Creating an end-to-end IoT solution using the Microsoft Azure IoT Starter Kit w/ Adafruit Feather M0 WiFi and Microsoft Azure
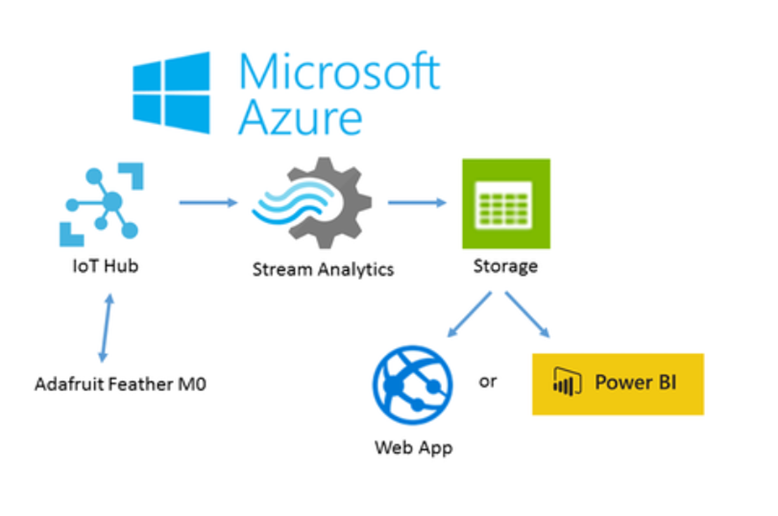
This tutorial guides you through the following stages in developing your first IO Device connected to Azure IOT which then passes data via Stream Analytics to a Storage system which then presents a visualisation directly on a Web page or as Power BI report.
Stage 1Arduino setup and connect it to Microsoft Azure IoT Suite.
The Arduino IDE can be downloaded from here.
Azure Setup
There are two options for setting up Azure to collect and process temperature and humidity data from the device: utilize Azure IoT Suite's pre-configured Remote Monitoring solution or deploy and configure individual Azure IoT Suite components.
Option 1 – Using AzureIotsute.com Wizard:
- It has all the necessary Azure IoT Suite components pre-configured to deliver an out-of-the-box IoT solution. You literally get a full cloud solution with a few clicks and don't need to know anything about what's going on inside of Azure.
- The dashboard enables you to easily manage your devices - again just a few clicks to create a new device.
- It has a pre-built web dashboard for viewing the data.
- The dashboard also allows you to go beyond this project with functionality for alerts and pushing messages to the device.
- Since it is completely pre-configured, the solution is deployed with 'mid-level' pricing tiers for each of the components. This standard configuration will cost about $40 per day. However, after deployment, you can go to the Azure Portal and modify the pricing tiers of each component. Microsoft had documented how to make those modifications here.
Option 2 - Individual Components:
- You need to deploy and configure each of the necessary Azure IoT Suite's components - Azure IoT Hub, Azure Stream Analytics, and Azure Storage - individually.
- You get familiar with the Azure Portal and how easy it is to manage multiple components.
- With the individual components option, Mirosoft's Power BI Desktop application is used to visualize the data.
- Since the individual components option is completely configurable, you can select the pricing tiers for each component. For this project, I chose the lowest pricing tiers when configuring each component and incurred about $1 per day in Azure charges (if you run the device 24 hours a day and therefore send a message to Azure every second or two, your charges will be more).
Choose the https://AzureIOTSuite.com option to get up and running quickly; choose the individual components option to dig into Azure a bit more in order to understand what's going on under the covers.
Option 1 – Using https://AzureIOTSuite.com
Create a New Azure Remote Monitoring Solution
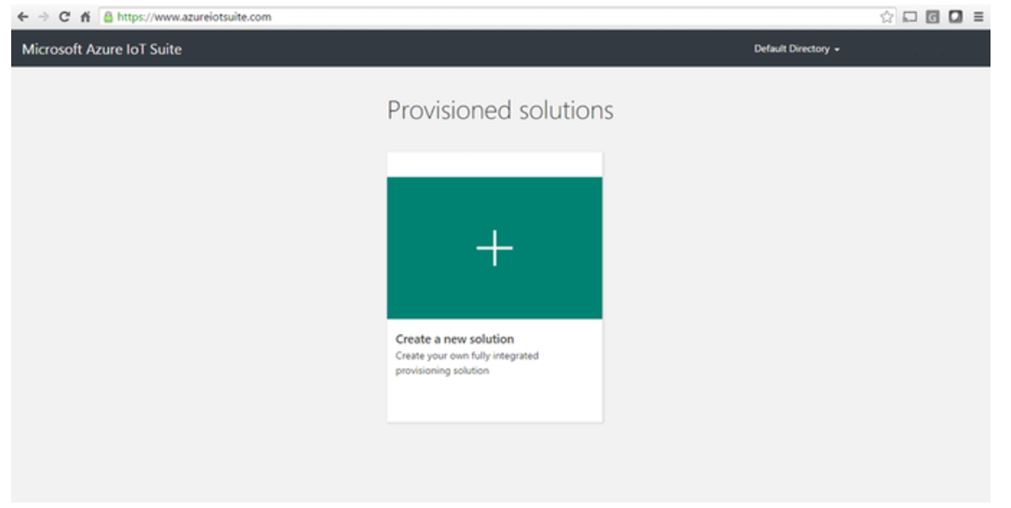
The AzureIOTSuite Wizard is comprised of Azure IoT Hub, Azure Stream Analytics, Azure Storage, and an Azure web application. But with the pre-configured solution, you get all those services provisioned and deployed in just a few clicks. Start by signing in to the Azure IoT Suite site.
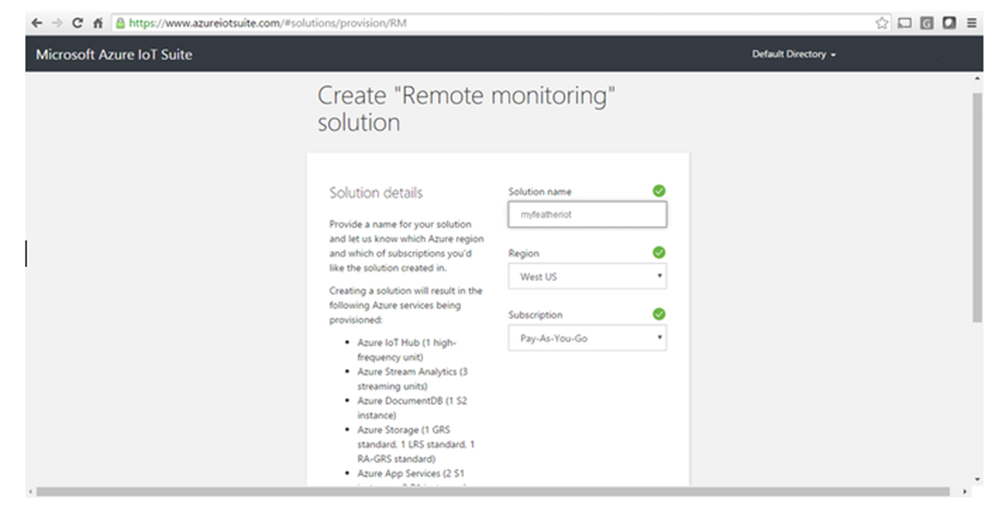
Once you have signed in to your Azure account, click on the plus sign to create a new solution, and then click 'Select' under Remote Monitoring.
Enter the name for your solution (it needs to be unique across all Azure IoT Suite solutions), select the region in which to deploy your solution (pick the one closest to you), select the subscription against which this solution will be billed, and scroll down and click 'Create'.
It will take couple of minutes for Azure to provision the solution. The tile for the solution will display 'Provisioning' until it's deployed at which time it will display 'Ready'. You can click on the image in the tile to see the key info about your solution and you can click on 'Launch' to go to the dashboard.
Create a New Device Identity in Azure
You'll notice when you first deploy the Remote Monitoring solution and go to the dashboard that there is already data. The solution comes pre-configured with a handful of simulated devices – you can delete those at any time if you wish.
Before deploying your device and sending data from it to Azure, you will need to define the device in Azure and get a device identity for it. Azure IoT Hub – the component of the Remote Monitoring solution that accepts messages from and sends messages to devices – authenticates each individual device before communicating with it. Therefore, every device must have its own identity registered with a specific IoT Hub. The Remote Monitoring solution makes managing devices easy – you can do it via the dashboard.
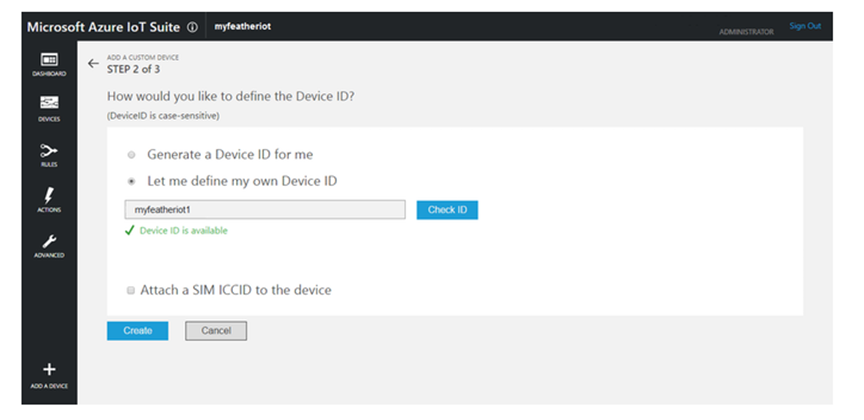
From the dashboard, click on the 'Add A Device' menu option at the bottom left and then click 'Add New' Custom Device. Enter a Device ID or allow Azure to create one for you and then click 'Create'.
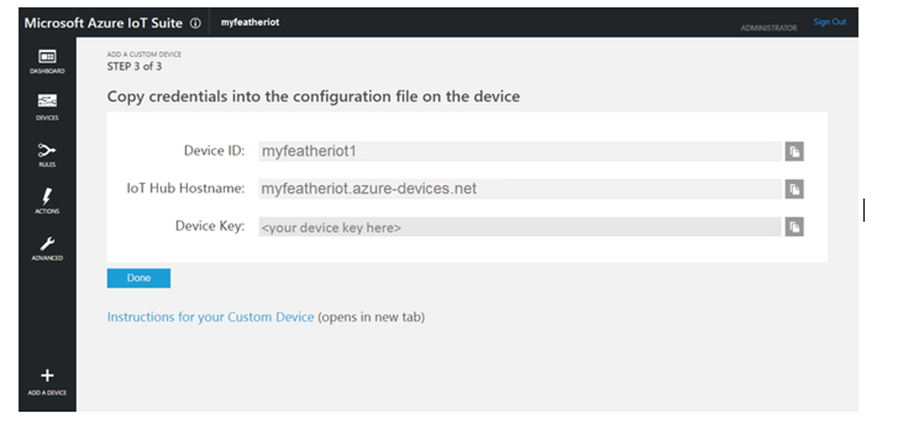
Next, the device's credentials will be displayed; copy this information as it will need to be added into your sketch so that the device can be authenticated when it attempts to hand off a message to IoT Hub. After you click 'Done', all the devices for this solution will be displayed including the one which was just created.
Now that you have completed the Azure setup using the Remote Monitoring option, skip to Device Setup.
Option 2 - Individual Components
Create a New Azure IoT Hub
Azure IoT Hub is a fully managed service that enables reliable and secure bi-directional communications between millions of IoT devices and an application backend. The Adafruit Feather M0 will package up the temperature and humidity data and send it to Azure IoT Hub; Azure IoT Hub is the entry point into Azure for data from IoT devices.
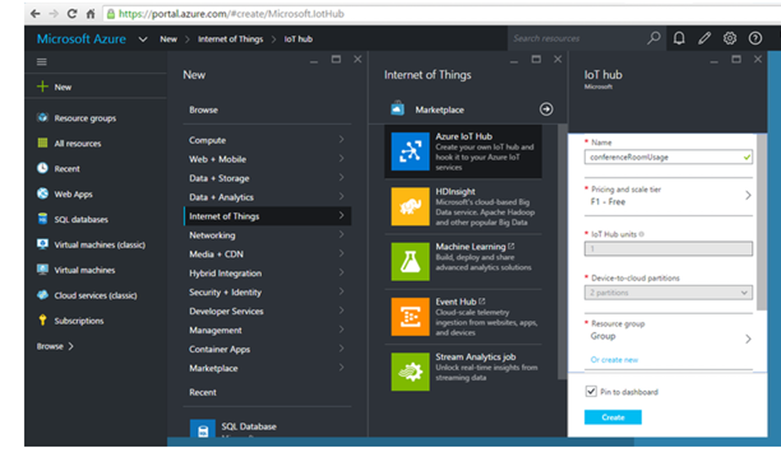
Start by signing in to the Azure Portal. Once you have signed in to the Azure portal, click on ‘+ New’, then click on ‘Internet of Things’, and finally click on ‘IoT Hub’ to create an IoT Hub. Enter a unique name (it must be unique across all Azure IoT Hubs not just across your account), chose a pricing and scale tier (the free tier – F1 – is sufficient for this project), leave IoT Hub units at 1 and device-to-cloud partitions at 2 (they aren’t editable for the free pricing tier), create a new resource group and name it whatever you like, select the region closest to you (keep all the services for this project in the same region), check ‘Pin to dashboard’, and click ‘Create’.
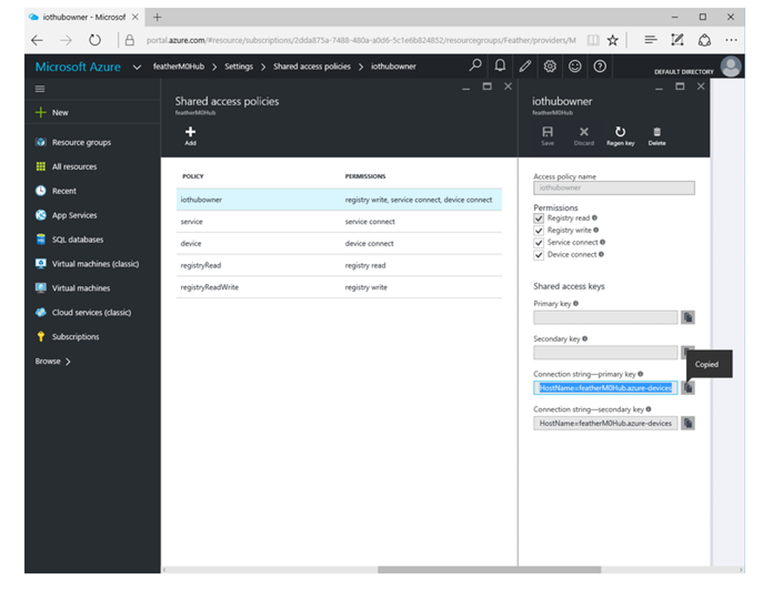
While Azure is provisioning the IoT Hub, the tile on the dashboard will show 'Deploying'. Once it completes, the tile will indicate that it is active; then click on the IoT Hub tile to view its settings. In the ‘Settings’ blade, click on ‘Shared Access Policies’. In the ‘Shared Access Policies’ blade, click on ‘iothubowner’. In the ‘iothubowner’ blade, copy the ‘Connection string – primary key’ by clicking on the copy icon. You’ll need the connection string in the next step.
Create a New Device Identity
Before deploying your device and sending data from it to Azure IoT Hub, you will need to define the device in Azure and get a device identity for it – Azure IoT Hub individually authenticates any device attempting to communicate with it so your device needs a unique identity. You could create a console app in Visual Studio to create and manage a device since Azure makes all the necessary services available via APIs – here is a tutorial if you want to go that route. But, I find it much easier to use Device Explorer.
Device Explorer is a very helpful tool when working with Azure IoT Hub. It allows you to quickly manage device identities and to view messages sent to and from your Azure IoT Hub. To install a pre-built version of Device Explorer onto your Windows PC, download SetupDeviceExplorer.msi and run the installer. (For other platforms, use the Iothub Explorer tool.)
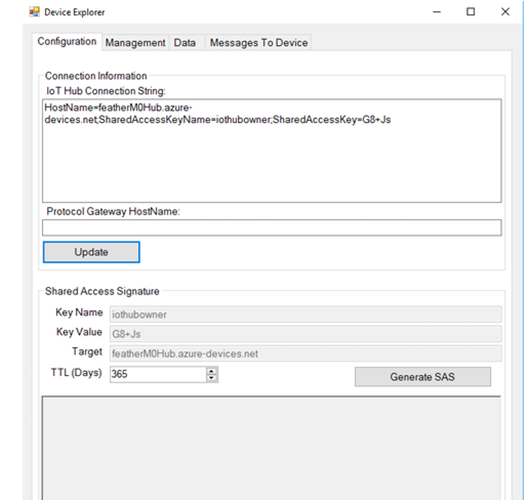
Launch Device Explorer. In the Configuration tab, paste the connection string you copied in the previous step and click ‘Update’ – the connection string specifies which IoT Hub to connect to as well as the necessary credentials (the shared access key) Device Explorer needs to authenticate itself to the IoT Hub. (Your shared access key will be much longer; I truncated mine for security.)
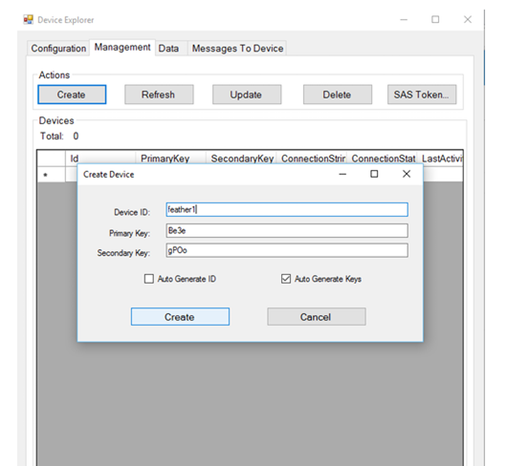
Next, go to the management tab to create a device identity for your IoT Hub. A device identity comprises of a device name and a device specific key. Click 'Create', enter your device ID in the ‘Create Device’ pop-up, and click ‘Create’; your device keys will be generated for you. The device's credentials will be displayed; copy this information as it will need to be added into your sketch so that the device can be authenticated when it attempts to hand off a message to IoT Hub. After you click 'Done', all the devices for this IoT Hub will be displayed including the one which was just created.
Create Azure Storage
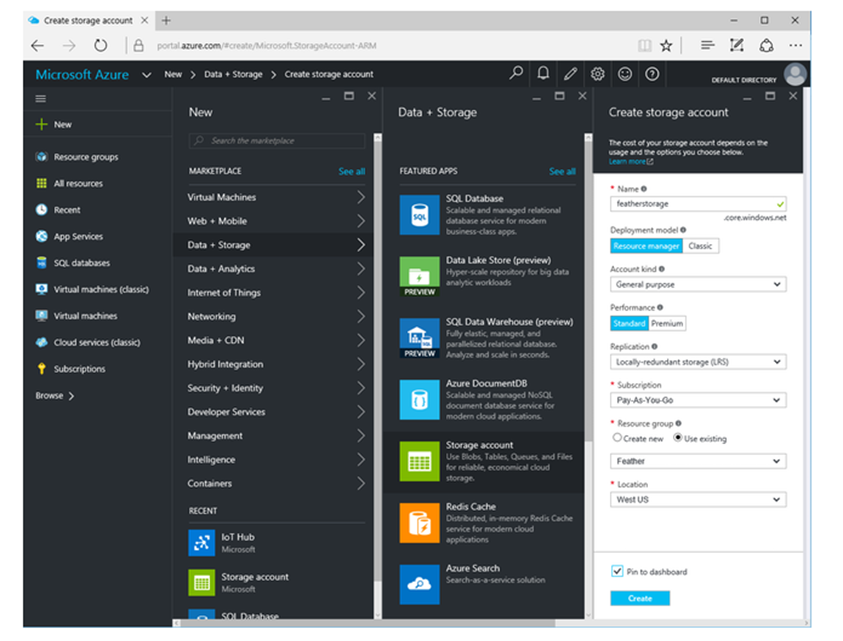
You’ll want to store the data sent from the device so that you can analyze it at any point in the future. Azure provides several different storage options; for this workshop, table storage works just fine – it’s well-structured which makes it easy to work with. Log into the Azure Portal, click New, click Data + Storage, and click Storage Account.
Now, a new blade will open where you can define your Storage Account:
- The Name for the Storage Account must be unique within Azure. There will be a red exclamation mark if the name already exists.
- Leave the deployment model of ‘Resource manager’ as is.
- Leave the account kind as ‘General purpose’.
- Leave the performance as ‘Standard’.
- Select ‘Locally-redundant storage (LRS)’ as the replication model; it is the least expensive.
- Select your subscription.
- Click the ‘Use existing’ radio button and select the resource group you created when you created the IoT Hub.
- Select the same location you specified for your IoT Hub.
- Check ‘Pin to dashboard’.
Once you have entered all the necessary info, click the ‘Create’ button. Azure will then create the storage account. At this point, you don't actually need to create a table within your Azure Storage Account for the output of the Stream Analytics job - once you define the output for Stream Analytics, a table will automatically be created for you.
Create Azure Stream Analytics Job
Azure Stream Analytics will process the messages sent to Azure IoT Hub. In the Stream Analytics job, you can specify any logic or transformations to apply to the data in the messages as well as where to route the data – in our case, we’ll move the data to Azure Storage without any modifications.
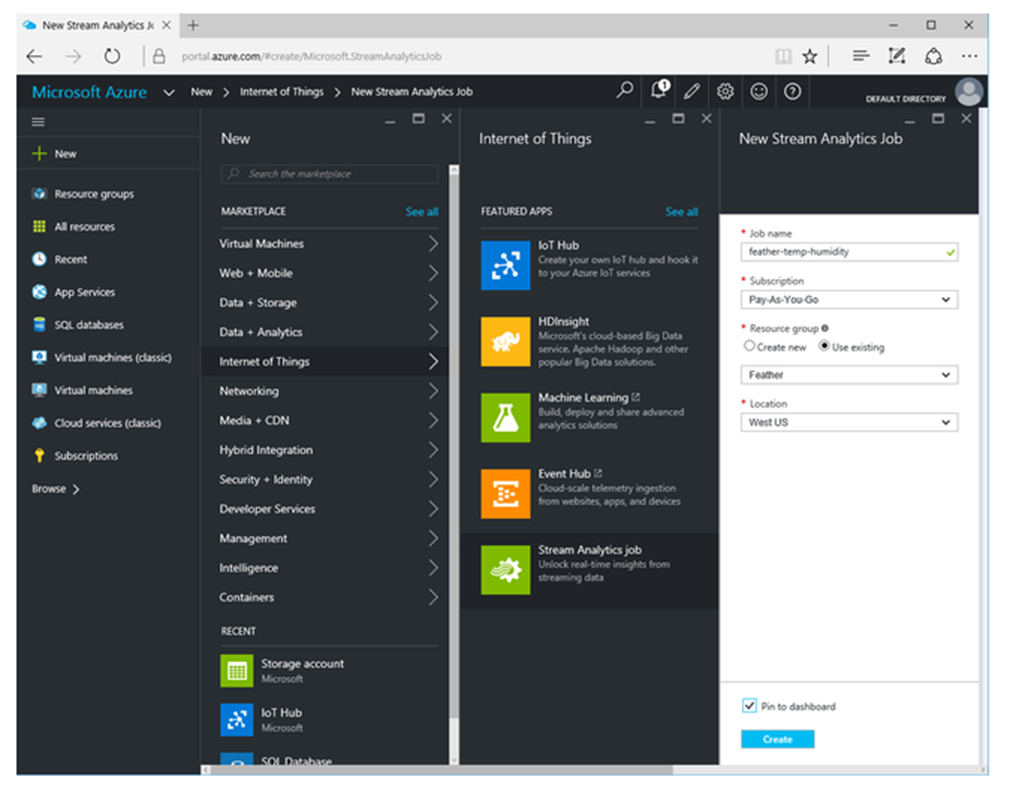
To create your Stream Analytics job, click ‘New’, click ‘Internet of Things’, and click ‘Stream Analytics job’. Then define your job in the ‘New Stream Analytics job’ blade:
- Enter the job name.
- Select your subscription.
- Select the same resource group as your other Azure IoT Suite services.
- Select the same location as your other Azure IoT Suite services.
- Check pin to dashboard.
Once you have entered all the necessary info, click ‘Create’.
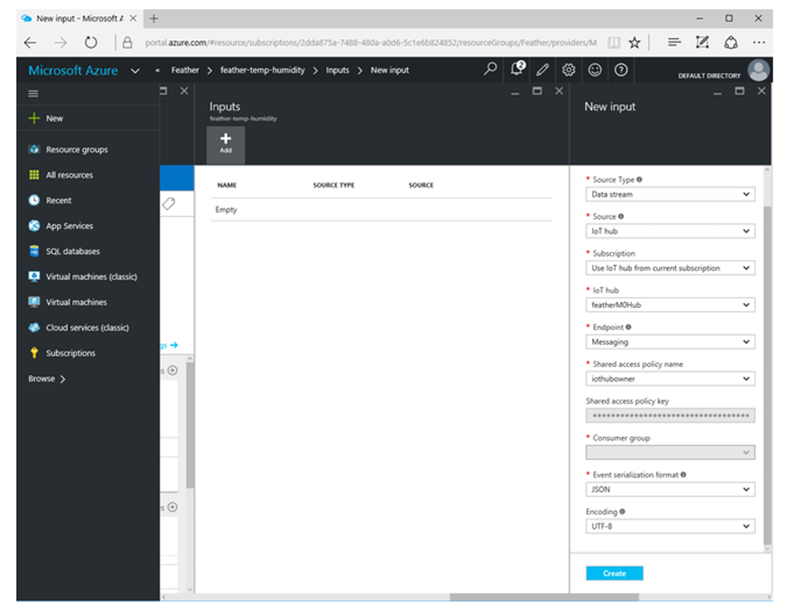
Now that the Azure Stream Analytics job has been created, you’ll need to configure what it does. First, define an input to the Stream Analytics job. Click on the ‘Inputs’ box in the ‘Job Topology’ section (if the settings blade for your Stream Analytics job didn’t automatically open once it was deployed, click on the tile on the dashboard). Then in the ‘Inputs’ blade, click the plus icon to add a new input and enter the following:
- Enter an alias or name for the input (you'll use this name when you create your query for the job). I called it ‘featheriothub’.
- Leave source type as ‘Data stream’.
- Select ‘IoT Hub’ as the source.
- Select ‘Use IoT hub from current subscription’ as the subscription.
- Select the IoT Hub you created earlier as the IoT Hub.
- Leave ‘Messaging’ as the endpoint.
- Leave ‘iothubowner’ as the shared access policy name.
- The shared access key should be prefilled and masked.
- Leave ‘JSON’ as the event serialization format.
- Leave ‘UTF8’ as the encoding.
Click ‘Create’. Azure will now create the input and test it (it may take about 30 seconds but you should receive a notification that the connection test was successful).
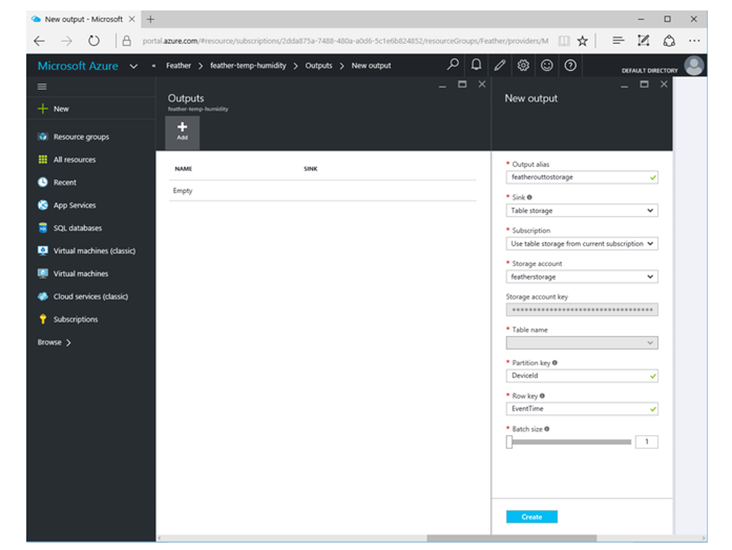
The second step in configuring the Stream Analytics job is to define an output. Close the ‘Inputs’ blade and click on the ‘Outputs’ box in the ‘Job Topology’ section. Then in the ‘Outputs’ blade, click the plus icon to add a new output and enter the following:
- enter the name for the output alias (you'll use this name when you create your query for the job).
- Select Table Storage for Sink.
- Leave subscription as is – ‘Use table storage from current subscription’.
- Select the table storage you created earlier.
- Leave storage account key as is (it’s not editable).
- Leave table name blank unless you created tables in which case you need to select the appropriate one.
- Enter the field name from the data set you are sending to IoT Hub which you want to use as the Partition key - I am using the DeviceId so that the table partitions together all the data from that device.
- Enter the field name from the data set you are sending to IoT Hub which you want to use as the Row key - I am using EventTime as I know that value will be unique for a given device.
- I left batch size at 1 – there is so little data in this project, relatively to what Azure can handle, that I don’t need to batch data up before outputting it to the table.
Click ‘Create’. Azure will now create the output and test it (it may take about 30 seconds but you should receive a notification that the connection test was successful).
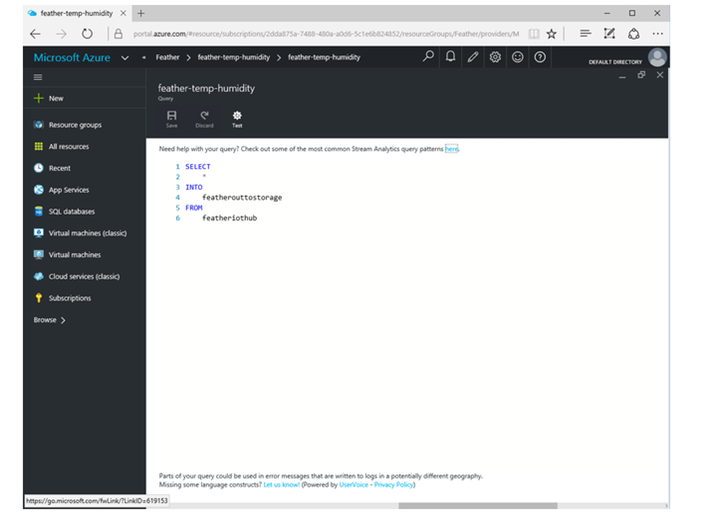
The final step in configuring the Stream Analytics job is to define a query. The query is where you can add some logic or transform the original data sent to IoT Hub before it is moved elsewhere for additional processing – or, in this case, moved to storage. Close the ‘Outputs’ blade and click on the ‘Query’ box in the ‘Job Topology’ section. You can leave the ‘Select’ part of the query as is – ‘*’ will select all the data from the IoT Hub. Edit the ‘Into’ and ‘From’ with the of the parts of the query with the output alias and input alias you just created. Click the ‘Save’ icon.
You now have an IoT Hub to accept the messages from the device and a Stream Analytics job to process the data in those messages and put the data in storage. That’s it for the Azure IoT Suite side of things.
Stage 2 Device Setup
Connect the BME280 Sensor to the Feather M0
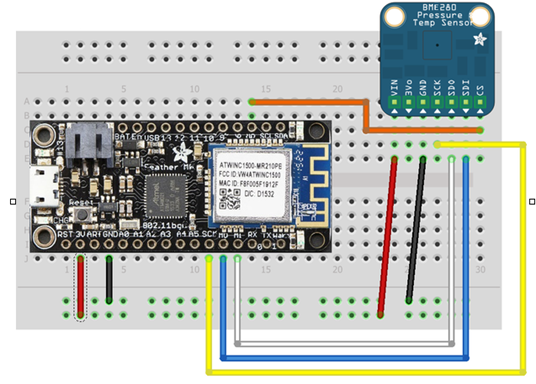
The BME280 sensor needs to be connected to the Feather M0 so that the Feather M0 can collect the temperature data from it. The easiest way to connect the sensor to the Feather M0 is to use a breadboard. The Feather’s pins are spaced so that it can be placed on a breadboard – as are the BME280’s. Once both components are mounted to the breadboard, male-male jumper wires can be used to make the necessary connections.
First, power the sensor by connecting the Vin and GND pins on the sensor to the power and ground rails of the breadboard. Then connect the breadboard’s power and ground rails to the Feather’s 3v and GND pins respectively. The BME280 sensor can communicate with the Feather via I2C or SPI. For this workshop, we are using SPI so make the following connections:
Feather Sensor Notes
Column on the left corresponds to the sensor and on the right to the board. On the image, the board is place between 10 and 30, with the RST pin connected to row 29, and sensor between 1 and 9, with the CS pin connected to the row 1. With this layout, you are able to connect wires next to the corresponding pins on the breadboard. Additionally, when counting the - and + pins, start from the right and count in, as these do not align with the numbers indicated on the board.
| Start | End | Cable Color |
|---|---|---|
| CS (Pin 1E) | CE0 (Pin 16B) | Orange cable |
| SDI (Pin 2E) | MO (Pin 18J) | Blue cable |
| SDO (Pin 3E) | MI (Pin 17J) | White cable |
| SCK (Pin 4E) | SCK (Pin 19J) | Yellow cable |
| GND (Pin 5E) | Pin 5- | Black cable |
| 3Vo (6E) | Pin 6+ | Red cable |
| Pin 21- | Pin 26J | Black cable |
| Pin 23+ | Pin 28J | Red cable |
| Start | End | Connector |
|---|---|---|
| B7 | B1 | BME280 |
- For more information regarding the sensor, see: Adafruit BME280 sensor setup
At the end of your work, your Feather M0 WiFi should be connected to the sensor. We'll test it in the next sections.
Add the Feather M0 WiFi Board to the Arduino IDE
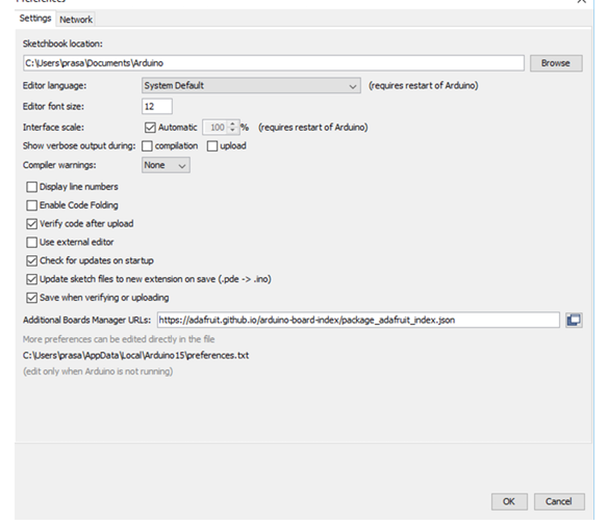
The Arduino IDE can support a variety of microcontrollers and so before you compile and deploy your sketch, you need to select the specific board you are targeting. The Feather M0 WiFi board is supported by the Arduino IDE but not “out-of-the-box” so you have to add it to the Arduino IDE yourself. Launch the Arduino IDE and open the Preferences dialog (it is accessed from the File menu). Then enter the following URL in the ‘Additional Boards Manager URLs’ text box:
https://adafruit.github.io/arduino-board-index/package_adafruit_index.json
If there is already an entry in this text box, add a comma after it before entering the URL above. Click the Ok button to save the changes.
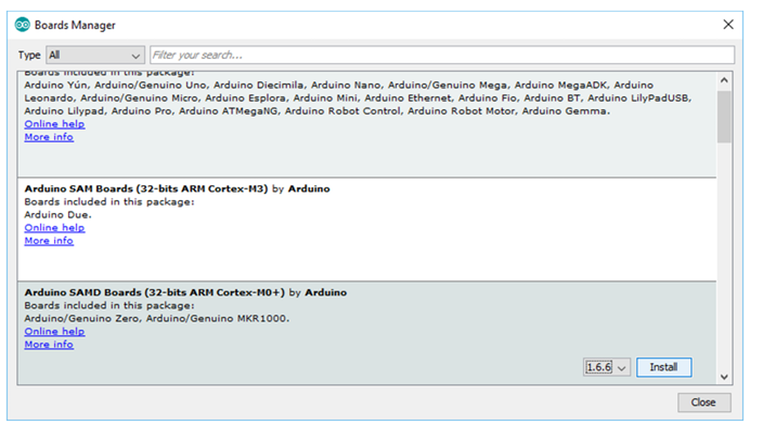
The Boards Manager dialog enables the user to add boards that aren’t supported by default (it is accessed from the Boards option under the Tools menu). Each time the Boards Manager dialog is opened, any URLs in the ‘Additional Boards Manager URLs’ text box will be checked for new boards or updates to existing boards. Once you open the Boards Manager, any and all boards that the Arduino IDE discovers will be listed. The first package which needs to be installed is the ‘Arduino SAMB Boards (32-bits ARM Cortex-M0+) by Arduino’ – install version 1.6.2 or greater (once you click on board in the dialog, an ‘Install’ button will be displayed if the board is not yet installed). It should be visible right away but if not, scroll down to find it or filter the results.
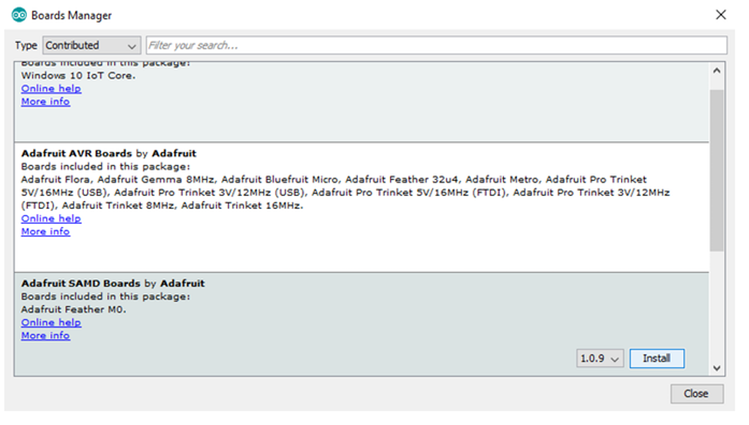
Next, install the ‘Adafruit SAMD Boards by Adafruit’ package. To find the package more easily, select ‘Contributed’ from the ‘Type’ drop down menu (in the top left hand corner of the Boards Manager dialog). If it’s still not visible scroll down or filter the results.
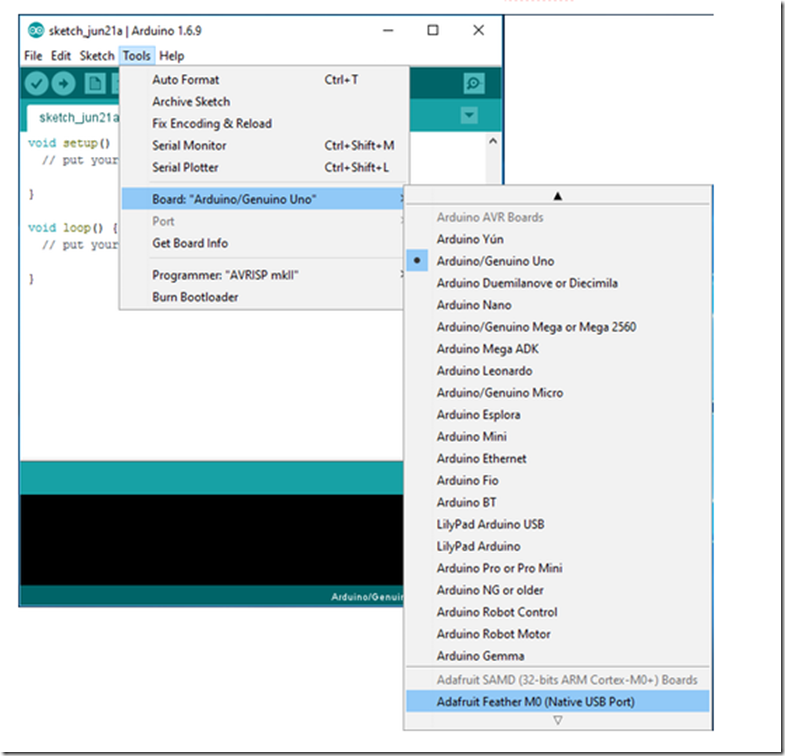
Once the Adafruit SAMD package is installed, restart the IDE. Then, go to the Boards option in the Tools menu and select the ‘Adafruit Feather M0’ from the list of boards. Once selected, the target board displayed in the Tools menu will be the Adafruit Feather M0.
Install the Required Libraries
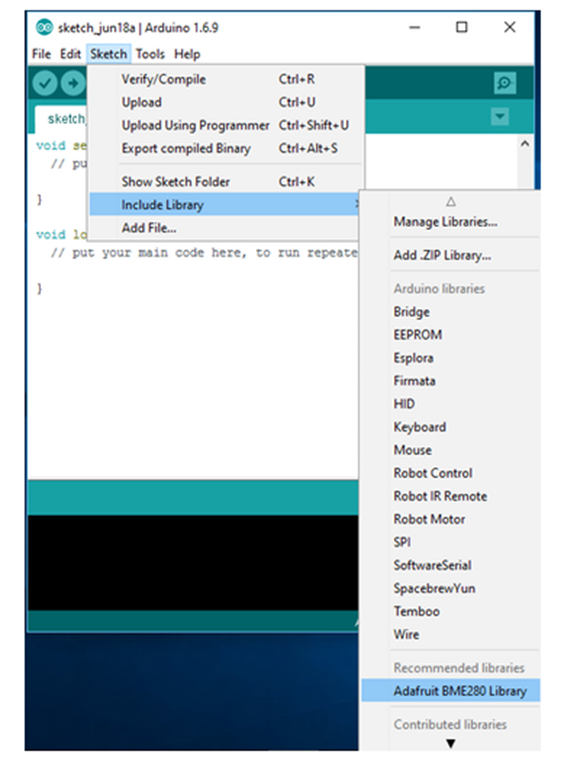
Libraries greatly simplify your Arduino sketches not only because you can leverage work done by others in your own projects but also because libraries usually encapsulate a lot of low level communication with hardware or Internet connected services into higher level functions with which your code can integrate. You’ll need to install five separate libraries into the Arduino IDE for this project:
- Adafruit BME280 Sensor Library – to easily integrate with the sensor hardware
- Adafruit WINC1500 Library – to easily utilize the Feather M0’s WiFi capabilities
- Adafruit Sensor Library – a further abstraction to integrate many sensors in a consistent way
- RTC Zero Library – to simplify the addition of time into your project
- Azure IoT Library – to simplify the communication with Azure IoT Hub
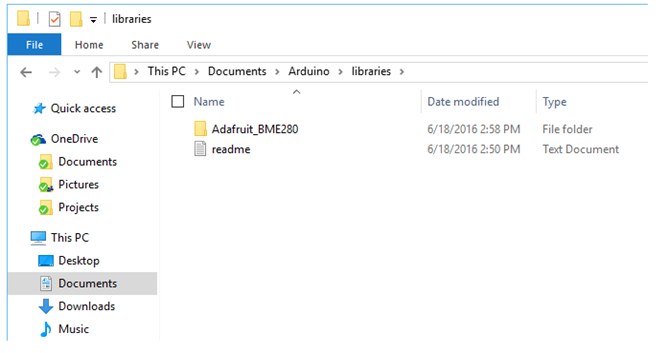
To install the Adafruit BME280 sensor library into the Arduino IDE, first, download the library from the GitHub repository. Next, unzip the archive and rename the library folder to ‘Adafruit_BME280’ (the archive folder contains the library folder so double click the archive folder to go down one level to the library folder – the library folder is what you want to rename). Lastly, move the ‘Adafruit_BME280’ folder to the libraries subfolder within the Arduino sketch folder - i.e. C:\Users\\Documents\Arduino\libraries (by default, the Arduino IDE creates an ‘Arduino’ folder within your Documents folder the first time it’s run).
Now, when you restart the Arduino IDE, you will see the Adafruit BME280 library. If not, double check the process you used to install the library against this tutorial from Adafruit.
Install the Adafruit WINC1500 library using the same process. First, download the library from the GitHub repository. Next, rename the uncompressed library folder to ‘Adafruit_WINC1500’. Lastly, move the ‘Adafruit_WINC1500’ folder to the libraries subfolder within the Arduino sketch folder.
Install the Adafruit Sensor library using the same process. First, download the library from the GitHub repository. Next, rename the uncompressed library folder to ‘Adafruit_Sensor’. Lastly, move the ‘Adafruit_Sensor’ folder to the libraries subfolder within the Arduino sketch folder.
Install the Arduino RTC Zero library using the same process as well. First, download the library from the GitHub repository. Next, rename the uncompressed library folder to ‘RTCZero’. Lastly, move the ‘RTCZero’ folder to the libraries subfolder within the Arduino sketch folder.
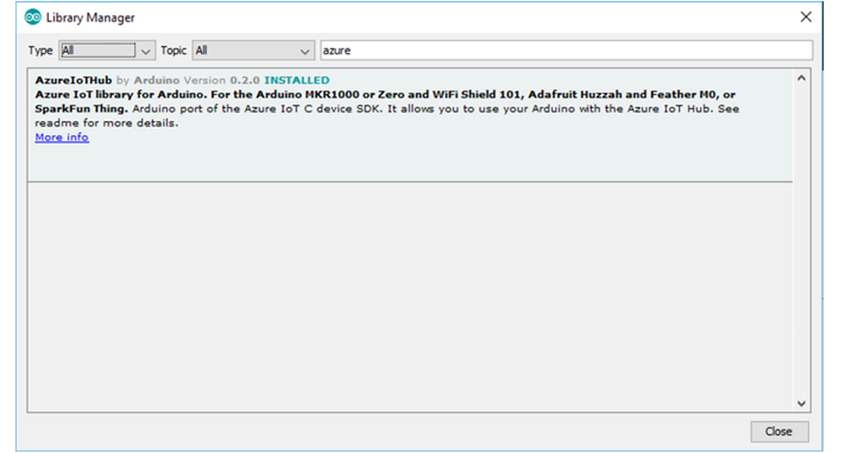
And finally, install the Azure IoT library. You can add the it the same way you added the other libraries or you can use the IDE’s library manager. To manually install it, first, download the library from the GitHub repository. Next, rename the uncompressed folder to ‘AzureIoTHub’. Lastly, move the ‘AzureIoTHub’ folder to the libraries subfolder within the Arduino sketch folder.
To install the Azure IoT library via library manager, first, open the Library Manager (select Include Library option under the Sketch menu and then select Manage Libraries). Search for the Azure IoT library by entering ‘Azure’ in the filter text box. If you don’t find it, my sure you have ‘Any’ selected in the Type drop down. Then click on the ‘AzureIoTHub by Arduino’ library and click Install.
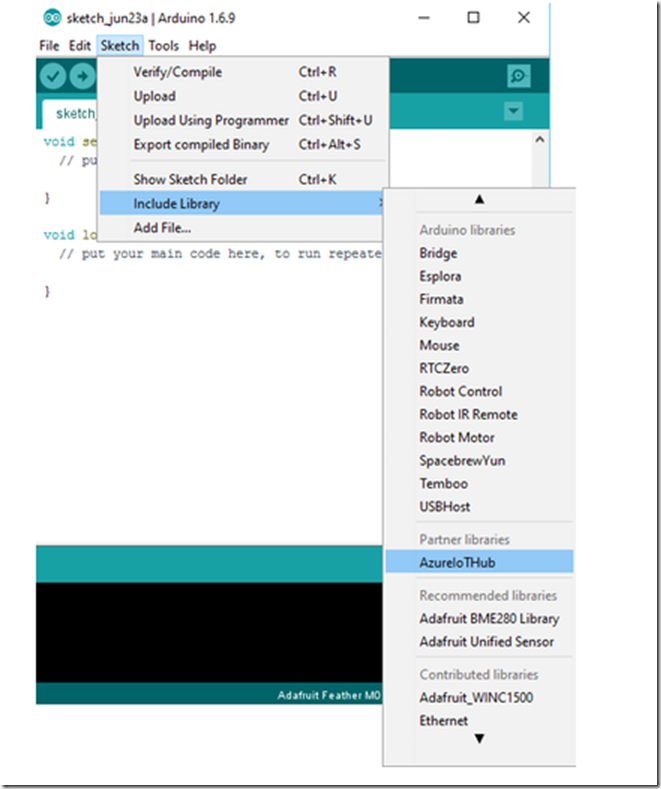
Regardless of which installation route you took, the Azure IoT library is now installed in your Arduino IDE. To verify the library installation, look for AzureIoTHub (along with the other libraries installed) in the list of installed libraries (select Include Library option under the Sketch menu).
Test Your Device
I always like to run a test sketch when I set up a new board to ensure that everything is ready to go before I dive into the project. Blinking an LED is always a good place to start – it’s easy and quick to do. Connect your Feather M0 to your PC and select the correct board and port from the Tools menu in the Arduino IDE. Then, build and deploy the following sketch:
 void setup() {
// put your setup code here, to run once:
pinMode(13, OUTPUT);
}
void loop() {
// put your main code here, to run repeatedly:
digitalWrite(13, HIGH);   // turn the LED on (HIGH is the voltage level)
delay(1000);              // wait for a second
digitalWrite(13, LOW);    // turn the LED off by making the voltage LOW
delay(1000);              // wait for a second
}
You should see the red LED next to the USB input start to flash. One thing to note if you want to modify the sketch – i.e. the flashing speed of the LED – and redeploy is that you need to put the Feather M0 back into bootloader mode before uploading another sketch. To do so, double-click the reset button (on the other side of the USB input from the red LED); the red LED will now fade in and out to indicate bootload mode. Then, upload any changes you made to the sketch and observe the modified behavior of the LED.
Stage 3
Deploy the Sketch
Modify the Sample Code for Your Environment
First, download the sample code from the GitHub repository. Unzip the archive and move its contents to your local Arduino sketch folder – i.e. C:\Users\\Documents\Arduino. Launch the Arduino IDE and open the ‘remote_monitoring.ino’ sketch.
Second, modify the sample code for your WiFi network. Scroll down through the code until you find the definition for the WiFi network and password and modify the strings with your network’s info.
 static const char ssid[] = "[Your WiFi network SSID or name]";
static const char pass[] = "[Your WiFi network WPA password or WEP key]";
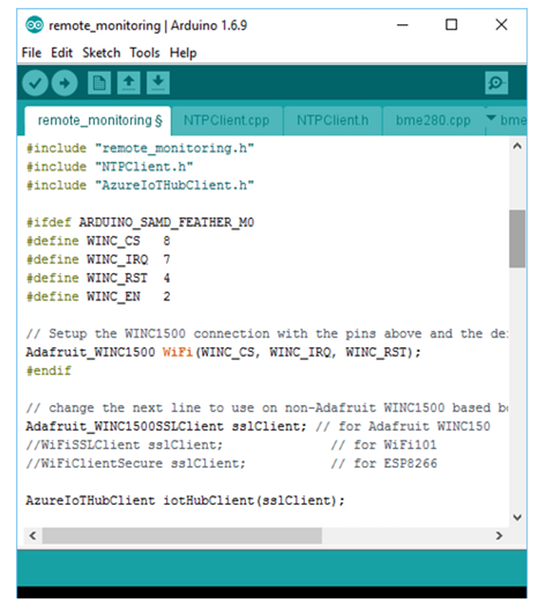
Next, specify which SSL client this IoT Hub client will use – different microcontrollers require different code for the SSL connection. You’ll first need to ensure that the AzureIoTHubClient is included in the ‘remote_monitoring.ino’ file. If not, add the following line to the list of other included libraries:
#include "AzureIoTHubClient.h"
Then, add the following to specify the SSL client:
 // change the next line to use non-Adafruit WINC1500 based boards/shields
Adafruit_WINC1500SSLClient sslClient; // for Adafruit WINC150
//WiFiSSLClient sslClient;              // for WiFi101
//WiFiClientSecure sslClient;           // for ESP8266
AzureIoTHubClient iotHubClient(sslClient);
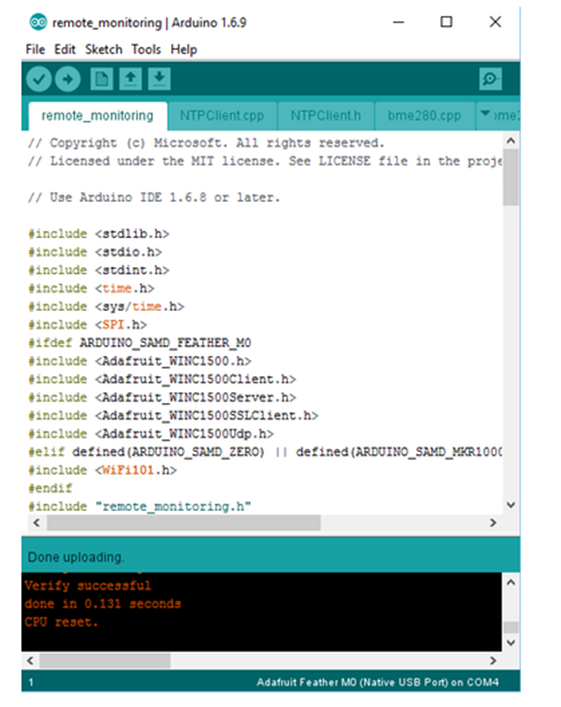
Save the changes. Your code should now look like this:
The last modification is in the ‘remote_monitoring.c’ file. To switch to that file in the IDE, click on the down arrow in the tab section near the top of the window and click on the file from the list. (Alternatively, you can widen the size of your window so that all the tabs can be seen and then select the ’remote_monitoring.c’ tab.) Modify the connection information to match the Azure service you created earlier in the workshop so that the device can be authenticated with it communicates with the IoT Hub. All the necessary information was displayed after you added a new device. The ‘hubName’ is the name you gave your remote monitoring solution (option 1) or your IoT Hub (option 2) (it’s the IoT Hub Hostname up to the first period). In this example, based on option 1, the connection information would like this (except in the code, the deviceKey would be filled in):
 static const char* deviceId = "myfeatheriot1";
static const char* deviceKey = "[device-key]";
static const char* hubName = "myfeatheriot";
static const char* hubSuffix = "azure-devices.net";
Build and Deploy the Sketch
Now, the sketch is all ready to go. Before deploying it, be sure that the Feather M0 is in bootloader mode – the red LED should be fading off and on. If not, double-click the reset button. Resetting the device will also cause it to disconnect from the COM port and reconnect so be sure to select the new COM port via Tools -> Port menu. Finally, build and deploy the sketch via Sketch -> Upload menu.
Version 1.6.8 of the Arduino IDE doesn’t update the status once it’s done uploading – version 1.6.9 does display the ‘Done Uploading’ status message correctly. With either version, you will see a ‘Verify successful’ message in the bottom frame of the IDE once the upload is complete. Additionally, the green LED (indicating a successful WiFi connection) on the Feather M0 will be lit up and the yellow LED (indicating data transfer over WiFi) will flash after the sketch has uploaded and starts running.
Stage 4
View the Results
Option 1 - Remote Monitoring
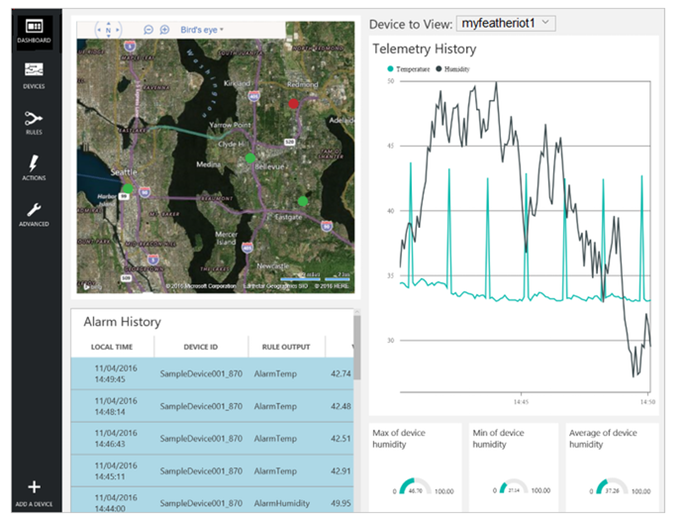
Remote Monitoring Dashboard
You can now view the data in the Remote Monitoring dashboard. Login to your Azure IoT Suite account and click the ‘Launch’ button on your Remote Monitoring solution’s tile. Make sure that the ‘Device to View’ in the upper right is set to your device rather than to a sample device. The graph will now update in real-time with data from your Feather M0.
Option 2 - Individual Components
Install Power BI Desktop and Get the Data
Microsoft Power BI Desktop is a free application that enables you to easily create dashboards and reports from your data. To get started, download and install Power BI Desktop and then launch the application. Before creating a visualization, you first have to point Power BI to the data set you want to analyze. To connect to the table in Azure into which your Stream Analytics job outputted the temperature and humidity data, click on "Get Data" in the top ribbon, select ‘Azure’ and then ‘Microsoft Azure Table Storage’ in the Get Data pop-up, and enter the name of your Table Storage Account – ‘featherstorage’ in my case – and access key. The Navigator will then connect to your Table Storage account and display the tables. If you turned on diagnostics for your Stream Analytics job, then there will be other tables in addition to the one where the data from the device was stored - select the table with the temperature and humidity data.
After selecting the appropriate table, you will need to do a small transformation on the data in order to break out the data into their own columns because the entire JSON object – with the device id, the temperature, and the humidity was stored in a single column in Table Storage. Once you have chosen the appropriate table from your Storage Account, click "Edit" rather than "Load" - this will launch the Query Editor. In Query Editor, select the "Content" column (this is the JSON object) and then select "Expand" from the "Structured Column" option (top right) in the "Transform" ribbon. Select the "ExternalTemperature" column; if you also want to analyze humidity, select the “Humidity” column as well (the visualization below only uses temperature). You don’t need to expand the DeviceId column - the DeviceId and EventTime are represented in the table via the Partition Key and Row Key columns respectively - and then click "OK". Finally, click "Close & Apply" from the "Home" menu.
Create Visualization
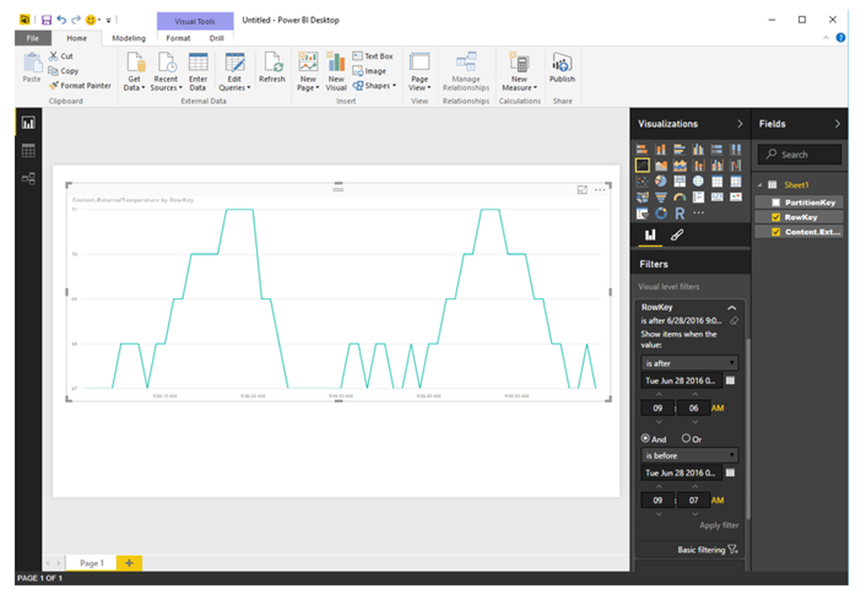
Now that we have the data, let's create a visualization. Start by creating a simple line graph to show the temperature over time. Select the Line Graph icon in the Visualizations blade. Then drag ‘RowKey’ from the Fields blade to the Axis in the Visualizations blade. Then drag ‘Content.ExternalTemperature’ to the Value. Next, add a filter to limit the line graph to a specific time interval - I limited it to a one-minute interval during which I blew on the sensor a couple of times to raise the temperature.
Now, create your own visualizations to see if you can discover any interesting results from your IoT solution.
Additional Resources
Hackster IOT Projects https://microsoft.hackster.io/en-US
Azure IOT Github – https://www.github.com/Azure
