Azure Machine learning and the teaching of predicative models
For the past few weeks i have been working with a lecturer at a UK University. The University wants to teach the concepts of predictive marketing to one of our courses. This is a large group (140+) undergrad students who have a wide range of statistical and maths knowledge.
The first query they have was they wanted to get hold of a historical (anonymous) data sample of customer demographics and purchasing behaviors, that they could analyze in class with our students
The purpose is to illustrate the concepts of customer conversion (from visiting to first buying) and retention (as repeated purchase), as well as customer lifetime value.
This is a perfect situation for teaching ML.
I went back to the lecture and asked a few more details its seems most Unis use Predictive Analytics by Omer Artun, which is very well written introducing key concepts.
For the practical exercises, sample data, to do,
Likelihood to engage and buy
Customer lifetime value analysis.
Bear in mind these are marketing management students mostly with limited statistical expertise. At present the course uses Basic excel functions to do basic analysis to illustrate the concepts rather than solving complex problems.
I introduced the team to Azure data market in azure marketplace and they have found this very useful so next I got them aware of what Machine Learning with Microsoft Azure is and Microsoft Azure Educator Grants which provide FREE cloud usage for teaching, learning and research.
I have done a number of blogs about these in the past here are some of my most popular ones.
Machine Learning in education
Getting started with Machine Learning in 10 steps
Undergraduate Lab scenarios
We have now progressed on to using the Machine learning challenge with students using Azure Passes and Microsoft Azure Educator Grants
The following is the process the team are using within their classes, the example below is a model to show how Azure and data market can be used within classes to get student understanding machine learning and put into practice the concepts they have learnt.
Creating a Machine Learning Workspace
To use Azure Machine Learning Studio from your Azure account, you need to have a Machine Learning workspace. This workspace contains the tools you need to create, manage, and publish experiments.
To create a workspace, sign-in to your Microsoft Azure account.
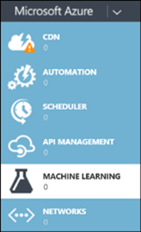
1. In the Microsoft Azure services panel, select MACHINE LEARNING.
2. Select +NEW at the bottom of the window.
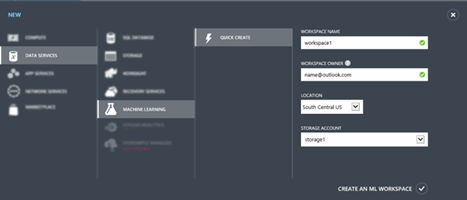
3. Select DATA SERVICES | MACHINE LEARNING | QUICK CREATE.
4. Enter a WORKSPACE NAME for your workspace and specify the WORKSPACE OWNER. The workspace owner must be a valid Microsoft account (e.g. name@outlook.com).
NOTE: Later, you can share the experiments you're working on by inviting others to your workspace. You can do this in Machine Learning Studio on the SETTINGS page. You just need the Microsoft account or organizational account for each user.
5. Specify the Azure LOCATION, then enter an existing Azure STORAGE ACCOUNT or select Create a new storage account to create a new one.
6. Select CREATE AN ML WORKSPACE.
Accessing Azure Machine Learning Studio
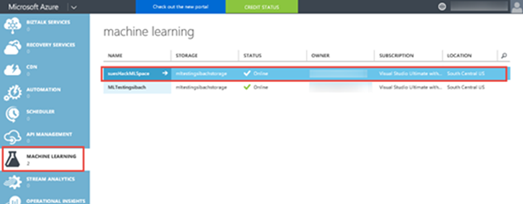
After your Machine Learning workspace is created, you will see it listed on the portal under MACHINE LEARNING. At the time this post was created Machine Learning Workspaces are always displayed in the Azure Classic portal (even if you select the menu option from the new portal to create it), at some point the new portal will be updated so you can list them without going to the Classic view.
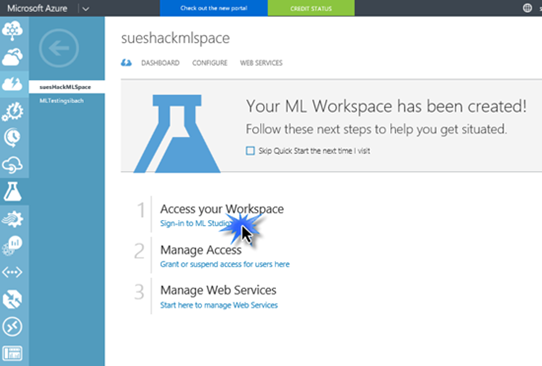
Once you have created your Machine Learning workspace, select your workspace from the list and then select Sign-in to ML Studio to access the Machine Learning Studio so you can create your first experiment!
When prompted to take a tour select Not Now. You may want to take a tour later when you are exploring this tool on your own.
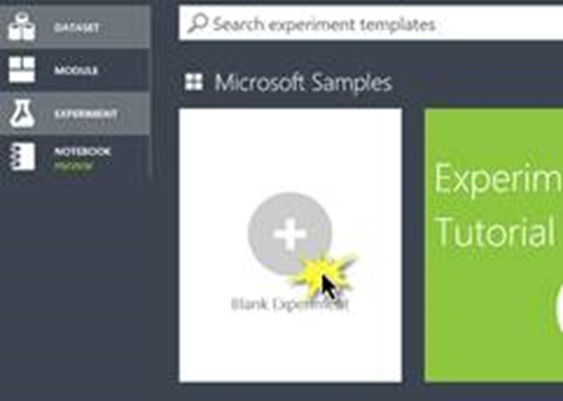
At the bottom of the screen select +NEW 
then select +Blank Experiment
Change the title at the top of the experiment to read “My first Azure ML experiment”
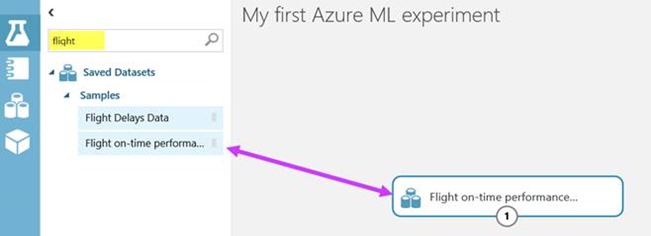
Type “flight” into the search bar and drag the Flight on-time performance Dataset to the workspace. This is one of many sample datasets built into Azure Machine Learning Studio designed to help you learn and explore the tool.
Right click on the dataset on your worksheet and select dataset | visualize from the pop-up menu, explore the dataset by clicking on different columns. It’s essential in Machine Learning to be familiar with your data. This dataset provides information about flights and whether or not they arrived on time. We are going to use Machine Learning to create a model that predicts whether a given flight will be late.
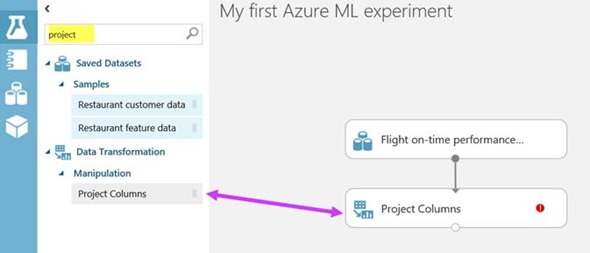
Type “project” into the search bar and drag the project columns task to the workspace. Connect the output of your dataset to the project columns task input
The project columns task allows you to specify which columns in the data set you think are significant to a prediction. You need to look at the data in the dataset and decide which columns represent data that you think will affect whether or not a flight is delayed. You also need to select the column you want to predict. In this case we are going to try to predict the value of ArrDel15. This is a 0/1 column that indicates whether a flight arrival was delayed by more than 15 minutes.
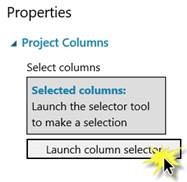
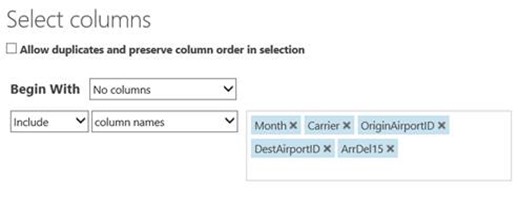
Click on the Project columns task. On the properties pane on the right hand side, select Launch column selector
Select the columns you think affect whether or not a flight is delayed as well as the column we want to predict ArrDel15. In the following screenshot, I selected Month, Carrier (airline), OriginAirportID, DestAirportID, and ArrDel15. You might select more or less columns.
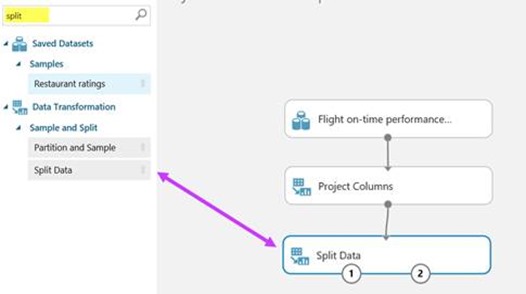
Type “split” into the search bar and drag the Split Data task to the workspace. Connect the output of Project Columns task to the input of the Split Data task.
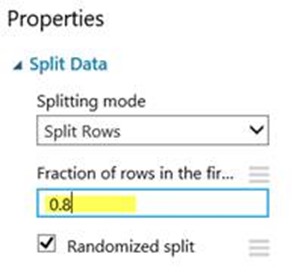
The Split Data task allows us to divide up our data, we need some of the data to try and find patterns and we need to save some of the data to test if the model we create successfully makes predictions. Traditionally you will split the data 80/20 or 70/30. For today’s challenge everyone will use 80/20.
Click on the Split Data task to bring up properties, specify .8 as the Fraction of rows in the first output
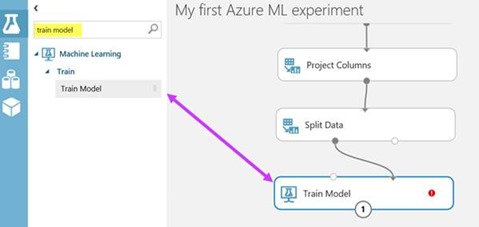
Type “train model” into the search bar. Drag the train model task to the workspace. Connect the first output (the one on the left) of the Split Data task to the rightmost input of the Train model task. This will take 80 % of our data and use it to train/teach our model to make predictions.
Now we need to tell the train model task which column we are trying to predict with our model. In our case we are trying to predict the value of the column ArrDel15 which indicates if a flight arrival time was delayed by more than 15 minutes.
Click on the Train Model task. In the properties window select Launch Column Selector. Select the column ArrDel15.
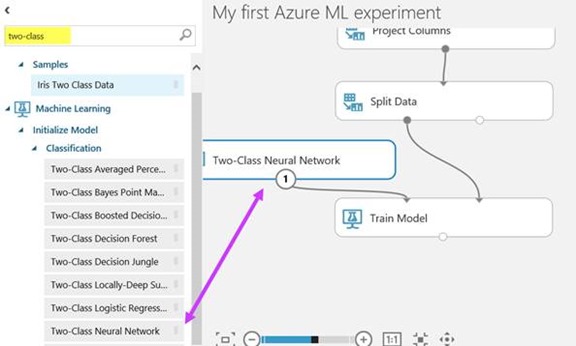
If you are a data scientist who creates their own algorithms, you could now import your own R code to try and analyze the patterns. But, we can also use one of the existing built-in algorithms. Type “two-class” into the search bar. You will see a number of different classification algorithms listed. Each of the two-class algorithms is designed to predict a yes/no outcome for a column. Each algorithm has its advantages and disadvantages. Select Two-Class Neural Network and drag it to the workspace.
Connect the output of the Two-Class Neural Network task to the leftmost input of the train model task.
After the model is trained, we need to see how well it predicts delayed flights, so we need to score the model by having it test against the 20% of the data we split to our second output using the Split Data task.
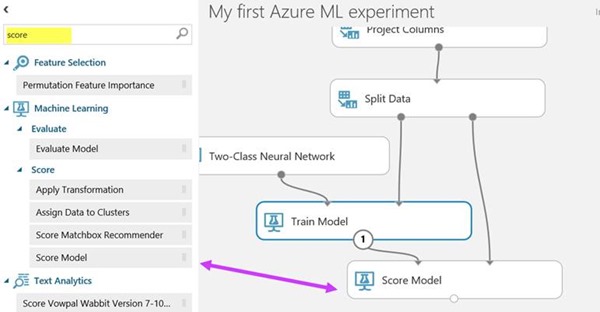
Type “score” into the search bar and drag the Score Model task to the workspace. Connect the output of Train Model to the left input of the Score model task. Connect the right output of the Split Data task to the right input of the Score Model task as shown in the following screenshot.
Now we need to get an evaluation of how well our model tested.
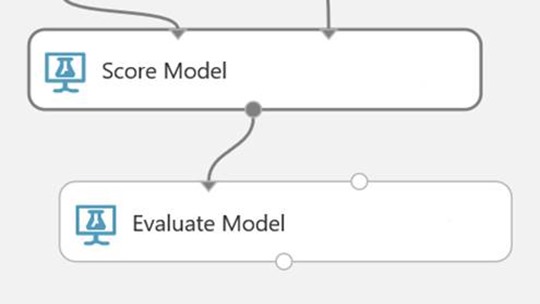
Type “evaluate” into the search bar and drag the Evaluate Model task to the bottom of the workspace. Connect the output of the Score model task to the left input of the Evaluate Model task.
You are now ready to run your experiment!
Press Run on the bottom toolbar. You will see green checkmarks appear on each task as it completes. When the entire experiment is completed right click on the evaluate model task and select “ Evaluation results | Visualize” to see how well your model predicted delayed flights.
How to interpret your results
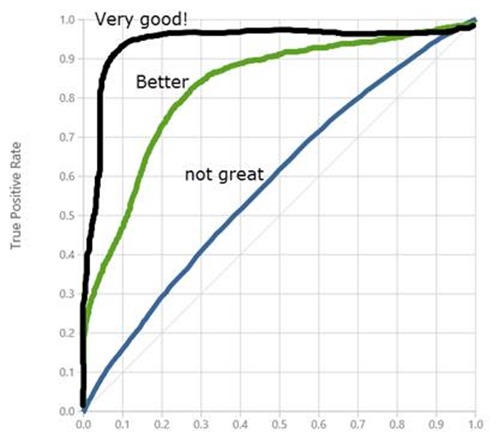
The closer the graph is to a straight diagonal line the more your model is guessing randomly. You want your line to get as close to the upper left corner as possible.
If you scroll down you can see the accuracy – Higher accuracy is good!
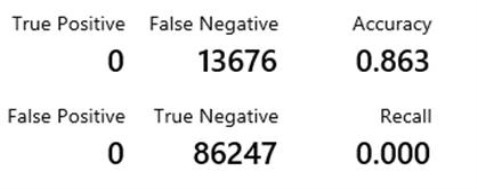
You can also see the number of false and true positive and negative predictions
· True positives are how often your model correctly predicted a flight would be late
· False positives are how often your model predicted a flight would be late, when the flight was actually on time (your model predicted incorrectly)
· True negatives indicate how often your model correctly predicted a flight would be on time (arrDel15 is false)
· False negatives indicate how often your model predicted a flight would be on time, when in fact it was delayed (your model predicted incorrectly)
You want higher values for True positives and True negatives, you want low values for False Positives and False negatives.
You can see from the results above my model predicted every single flight would be on time, not very helpful! I think we need to try something else…
If your interested in using Machine Learning or want to know more about Azure Educator grants for other Azure Cloud based services please get in touch.
Also I love to hear from you if your teaching using Azure.
