A unique approach to measuring effectiveness
Last week, I was at the Virus Bulletin conference where one of the presenters, Igor Muttik of McAfee, presented a different approach to measuring a filter’s effectiveness, especially when it comes to zero-day malware. I will attempt to paraphrase his presentation from memory.
Currently, whenever a particular malware outbreak or new spam campaign appears on the wire, we (ie, customers) frequently inquire whether or not there are definitions available in our filters that will catch it. Some filters have good proactive detection mechanisms and are able to catch new outbreaks without any new definitions being pushed out to production. However, it is unrealistic to expect this to occur for every new outbreak. The reason is that the malware authors or spam authors are constantly attempting to evade filters’ existing filtering mechanisms. They will actively attempt to circumvent any filters that exist and come up with a zero-day attack – an attack for which no virus or spam definitions are available and thus will pass through to customers undetected by any A/V or antispam solution.
When filters’ effectiveness are measured, it is usually a binary decision. Did we block it? Yes or no? This oversimplifies the problem of malware and spam. A filter may not block a campaign at a particular time, but 10 minutes later it might. It depends on the time it is measured. Furthermore, suppose a filter never blocks a spam or malware campaign. Is that a bad thing? We might think yes. But if that campaign only affected five people in real life? Is it that big a deal that we never write a definition for only 5 people when these typically affection millions? Which is better, blocking a new malware campaign that has 1 million occurrences in 30 minutes, or blocking a new malware campaign that affects 25 people in 5 minutes? Certainly, narrowing the window of time on the first one is more important than the second (targeted campaigns aside).
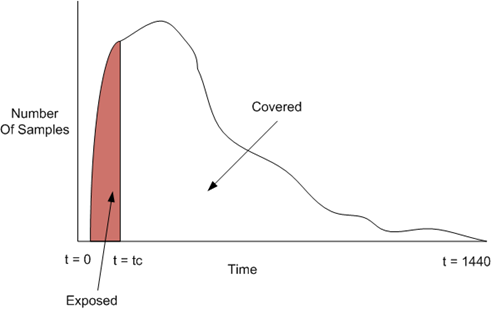
The proposal under discussion is to consider both time and frequency when evaluating a filter’s effectiveness. If we draw it on a chart, then if the horizontal access is time, and the vertical access is frequency (number of occurrences in real life sent to actual users), then we can graph it like the following:
In the graph above, our new malware campaign starts off very quickly and ramps up with a high number of samples. Let’s say that this is a minute chart and the above graph represents an entire day (1440 minutes in a day). At any time t, you can see the number of samples/occurrences that a particular botnet is spewing out to people. It starts off quickly and ramps up and peaks during the first 1/3 of the day and then gradually drops off.
Our filter takes time to react to this campaign and for a brief period of time the malware sails past the filters and hits people’s inboxes. Eventually, a new definition is created at time tc and the campaign is stopped. The exposed period of time is represented by the red area above and the covered period is the white area. If the above path/number of samples can be represented as a mathematical function, f(x), then to find out the total amount of coverage we have to go back to first year university calculus:
In other words, you integrate the area under the curve for the entire function and then subtract the area under the curve for the time in which the filter was exposed. The next step would be to normalize the number from a number between one and one hundred. Better yet, get a high number of examples like this an assign a statistical z-score. This plots the function on a bell curve and assigns an absolute value to the effectiveness.
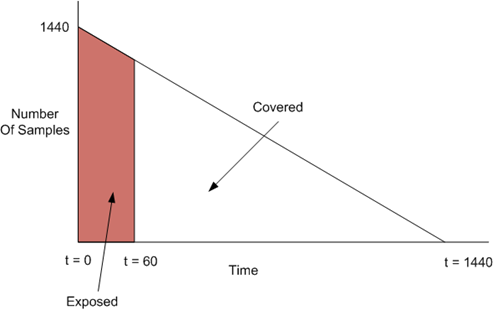
Let’s take an example. Suppose we had a malware campaign that sends out 1440 malware samples per minute, but one less the next minute and does this all day. The equation for this is f(x) = 1440 – x. It can be drawn like the following:
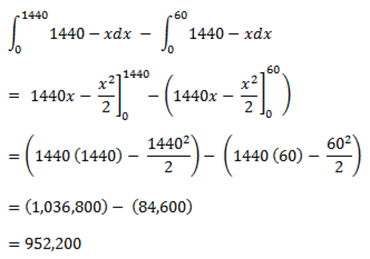
To normalize it, divide by the full value and we have 950,400 / 1,036,800 = 91.67%. Or, in this campaign we were 91.67% effective. Now suppose another campaign hit but was much bigger and instead of sending 1440 per minute, it sent 2880 per minute. The filter blocked it at the 60th minute, the same as last time. However, if you do the math then in this case the effectiveness is 91.84%. Even though it is blocked at the exact same time, the numbers shift to account for the spread of the attack.
The normalization is the tricky part. You’d need to fully read the paper by Muttik to account for everything in the normalization, but essentially the argument is that rather than assert how effective a filter is at a particular point in time, consider the breadth of the campaign before asserting how effective a filter is. My math is feeling rusty right now and I can’t get it down on e-paper the way it is floating around in my head, but you understand my point.
The drawback of this approach above (my approach, not sure if Muttik does it the same way as I am doing this from memory) is that while the equation accounts for effectiveness, it doesn’t quite account for impact. Even though case 1 was 91.67% and case 2 was 91.84% and case 2 looks better, the grim reality is that case 2 allowed more viruses. It seems counterintuitive that a number we derived doesn’t account for missed malware. The hunt for a better formula continues.


