Performance Rule for Log File Entries
Recently I had a customer request for tracking the number of specific entries in a log file every 30 seconds. The entries were indicative of website orders created and orders completed. Their commerce application would log these events to a plain txt file. Since the real metric that I'm after is the actual number of times that the specific log entries appear, I had to search for a specific regex and count the number of times there was a match. But because the log file would continuously grow, I had to keep track of the previous measurement and simply recognize the difference at each interval. I spit out a quick management pack to accomplish this. I'm posting it here because I have reason to believe that others might find this useful as well. .
NOTE: The two performance rules are DISABLED by default so you will have to enable them yourself.
As always, test this in a non-production environment first and use at your own risk.
Download below...
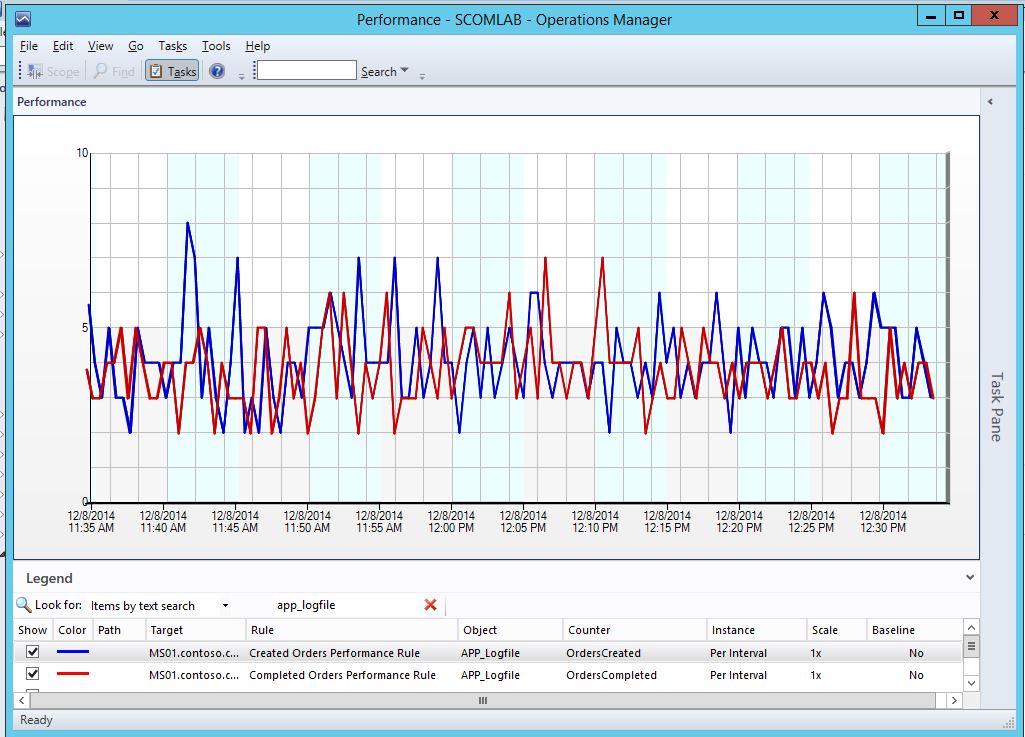
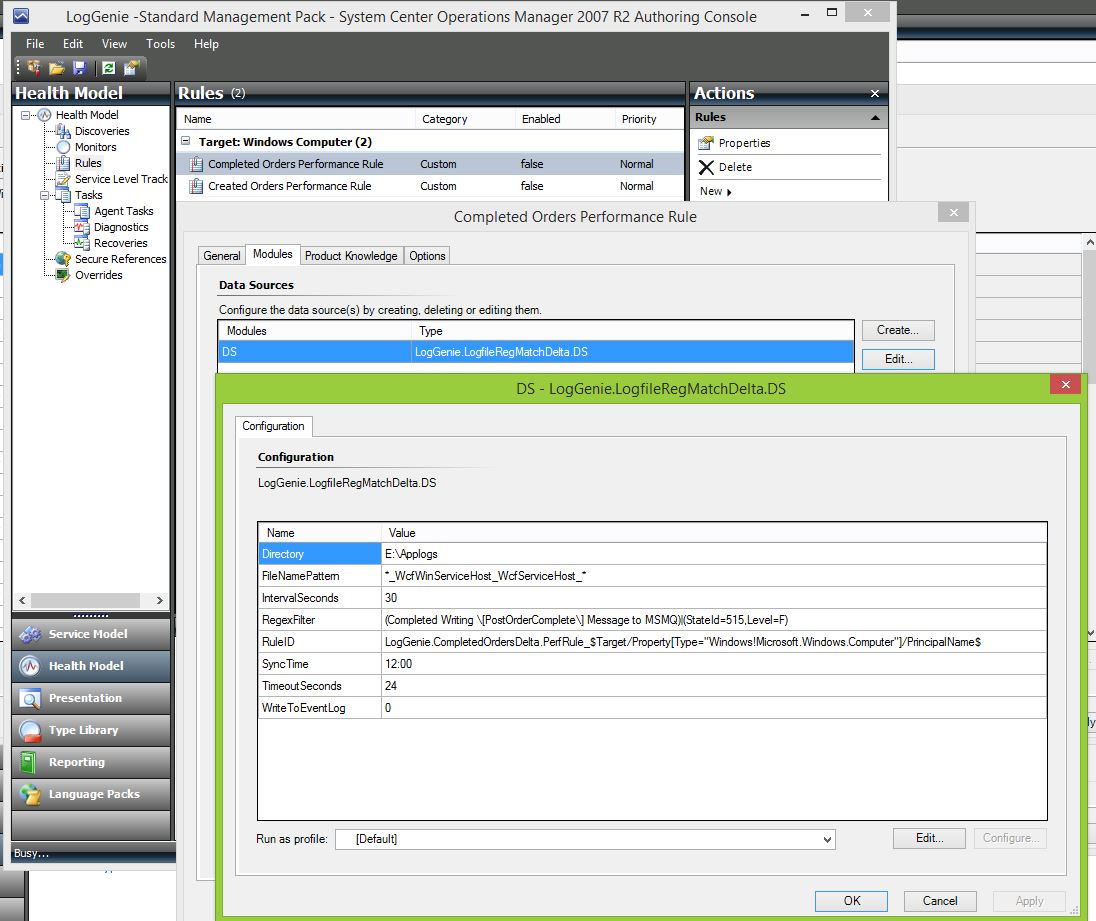
This is just a quick glimpse of the parameters passed into the data source. You'll notice that the Interval is presented generically in the graph view as "Per Interval". This is because you can change the Interval to whatever meets your needs and I didn't want to hardcode the Instance text to something specific like: " Every 30 Seconds".
Note: Because this MP was so basic I initially used the 2007 R2 Authoring Console. However, since then I converted it to use with Visual Studio, and have improved the Powershell datasource probe. The XML included with the download was generated by Visual Studio and you won't be able to open it with the R2 Authoring Console.
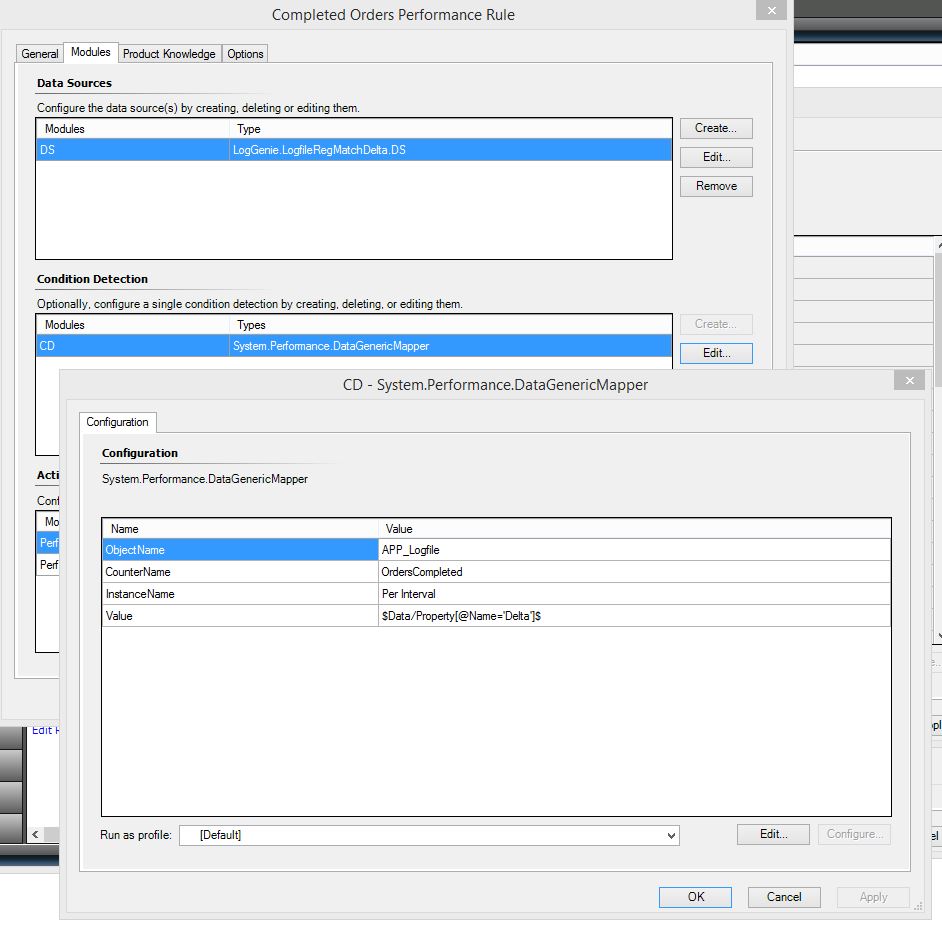
Feel free to change the Condition Detection parameters to fit your needs as well. You will have to do this in the XML.
2014-1-4 UPDATE:
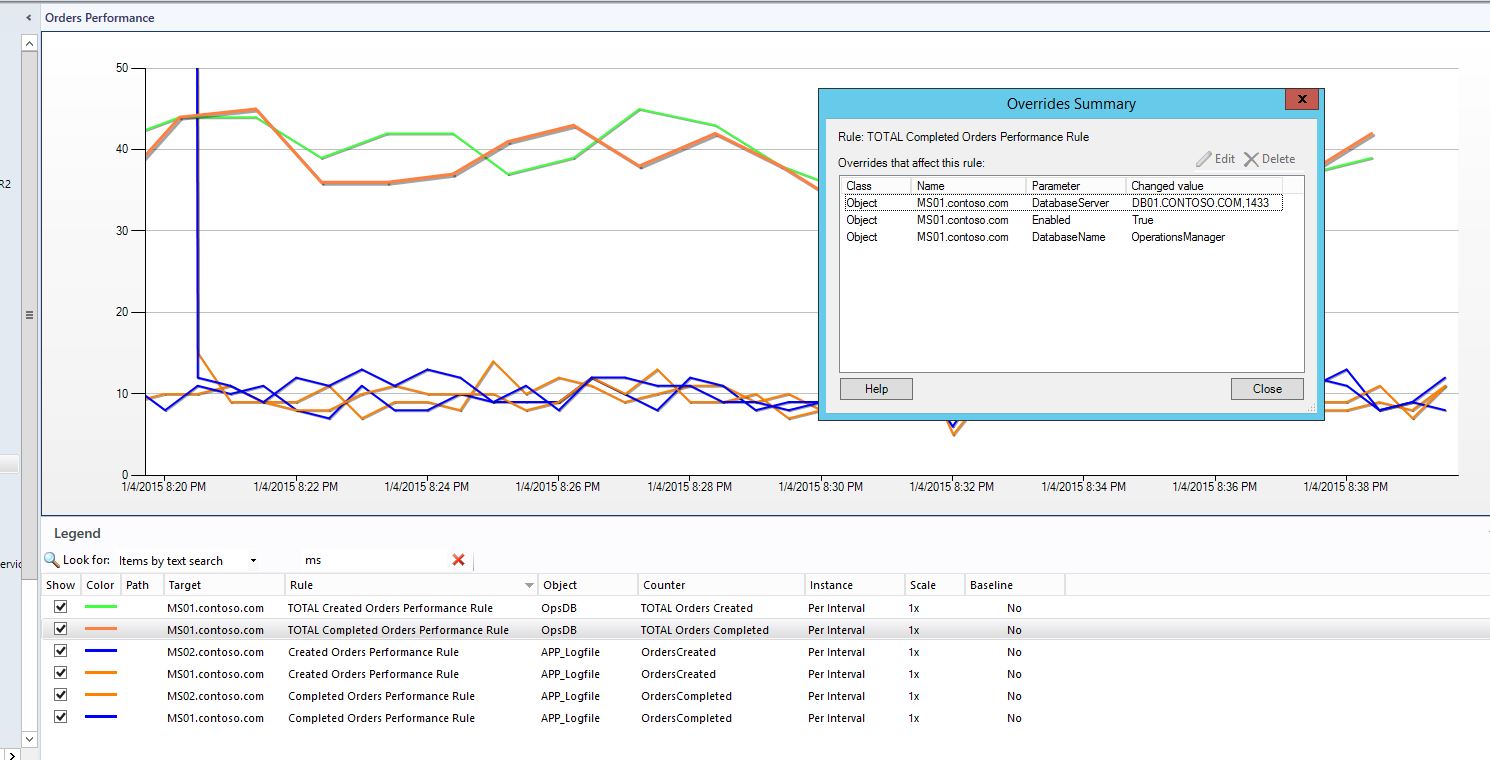
After I originally posted this MP the customer asked me to add some "Total" rules; rules that would show a performance graph for the Total number of orders created and total number of orders completed for all "created" and "completed" performance rules. They have around 50 app servers all of which are creating and completing orders and they wanted to see a graph for the sum of all orders performance. This is easily accomplished with the use of a basic SQL query to sum up the number of orders created/completed within the last X interval. This requires another management pack that I wrote for executing SQL Queries.
The two "Total" rules target the Windows Server class and are disabled by default. To configure these "Total" rules:
- Import the updated MPs: LogGenie and SQLServerQuery. Download links are below.
- Create overrides for the two “TOTAL” rules as follows:
The rules can be enabled/overridden for any Windows Server. The only significant requirement is that the target server have network access to your DB server on the correct port. Example: Enable the rules for your Operations Manager database server OR one of your management servers, and specify your Operations Manager Database Server name (fully qualified domain name) (or database cluster instance name) and Operations database name (if the OpsDB name is something other than the default: "OperationsManager"). - Make sure that the servername and instance (if named) are correct.
- The server name and instance name are easy enough however if a port is required, simply add it onto the instance name if an instance name is used. Or simply add it onto the server name.
Example with named SQL instance:
Server Name: mydbservername.com
Instance: myinstance,4567
If default instance with non-standard port:
Server Name: mydbservername.com,4567
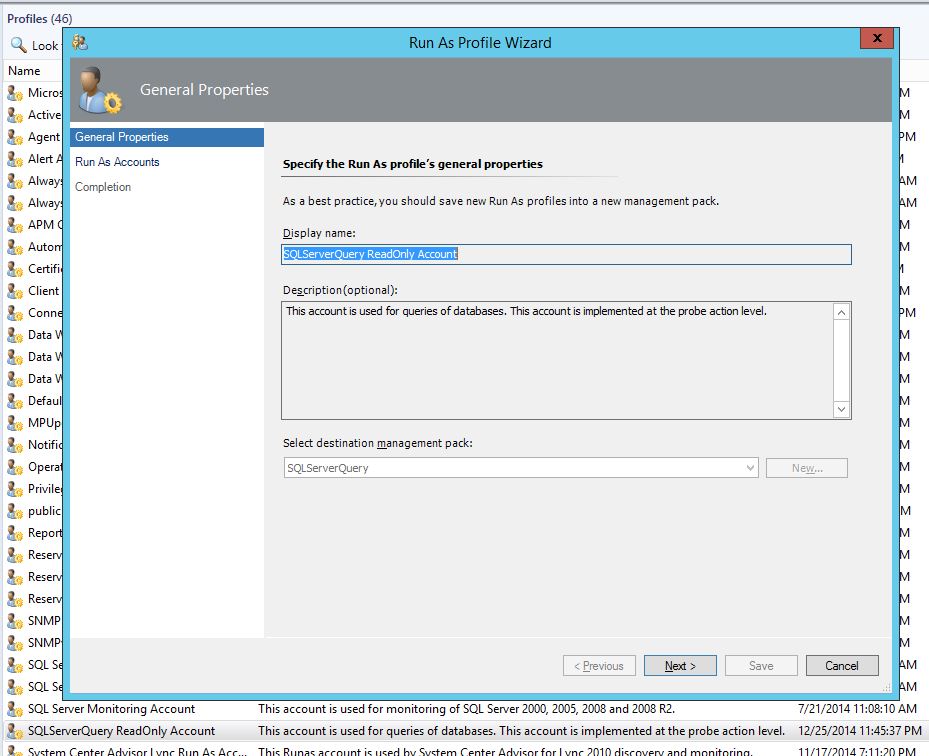
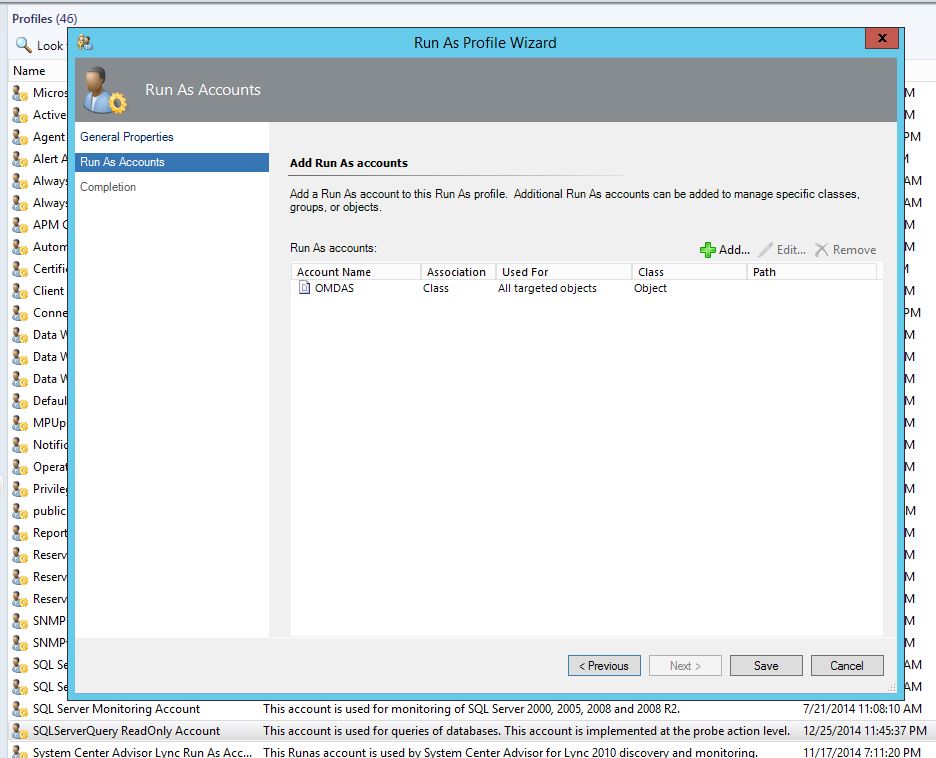
Make sure you create a RunAs account that has at least Read access to your OpsDB, then populate the security profile (SQLServerQuery ReadOnly Account) shown below with the account. This is required for the “Total” performance rules to run.
In my screenshots below I have used the OMDAS account which has more than "read-only" permissions. Be sure to use an account that is appropriate for your security policies.
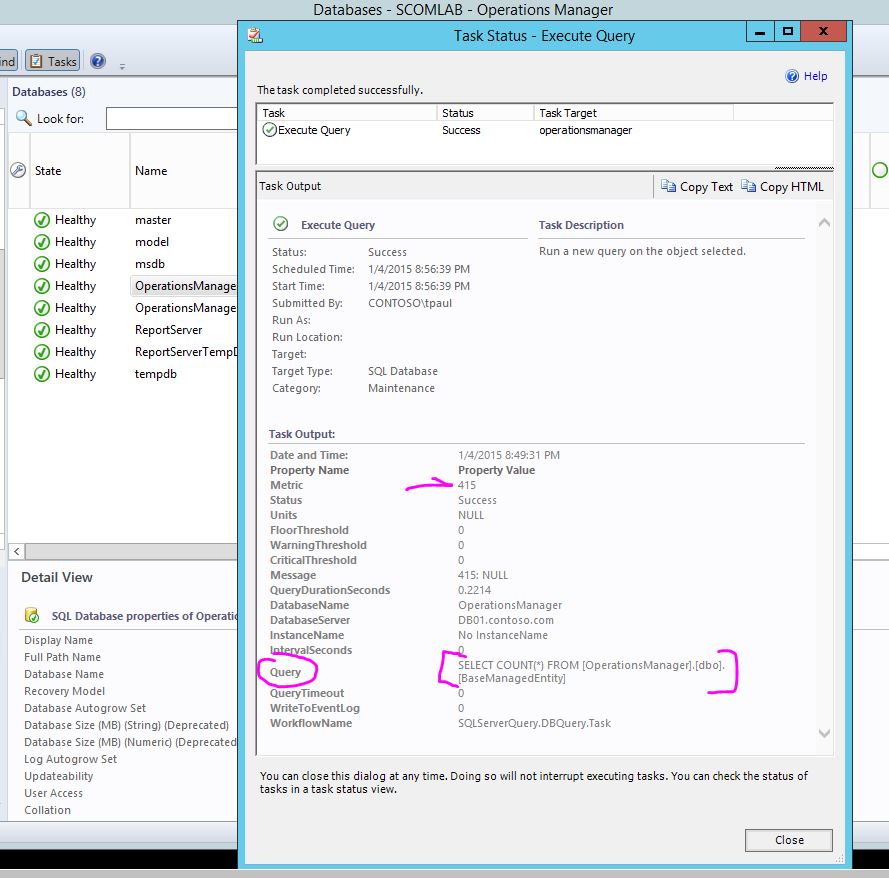
The SQLServerQuery MP also has a very handy Console Task: Execute Query which targets any SQL Database. The task uses the same security profile by default: (SQLServerQuery ReadOnly Account)
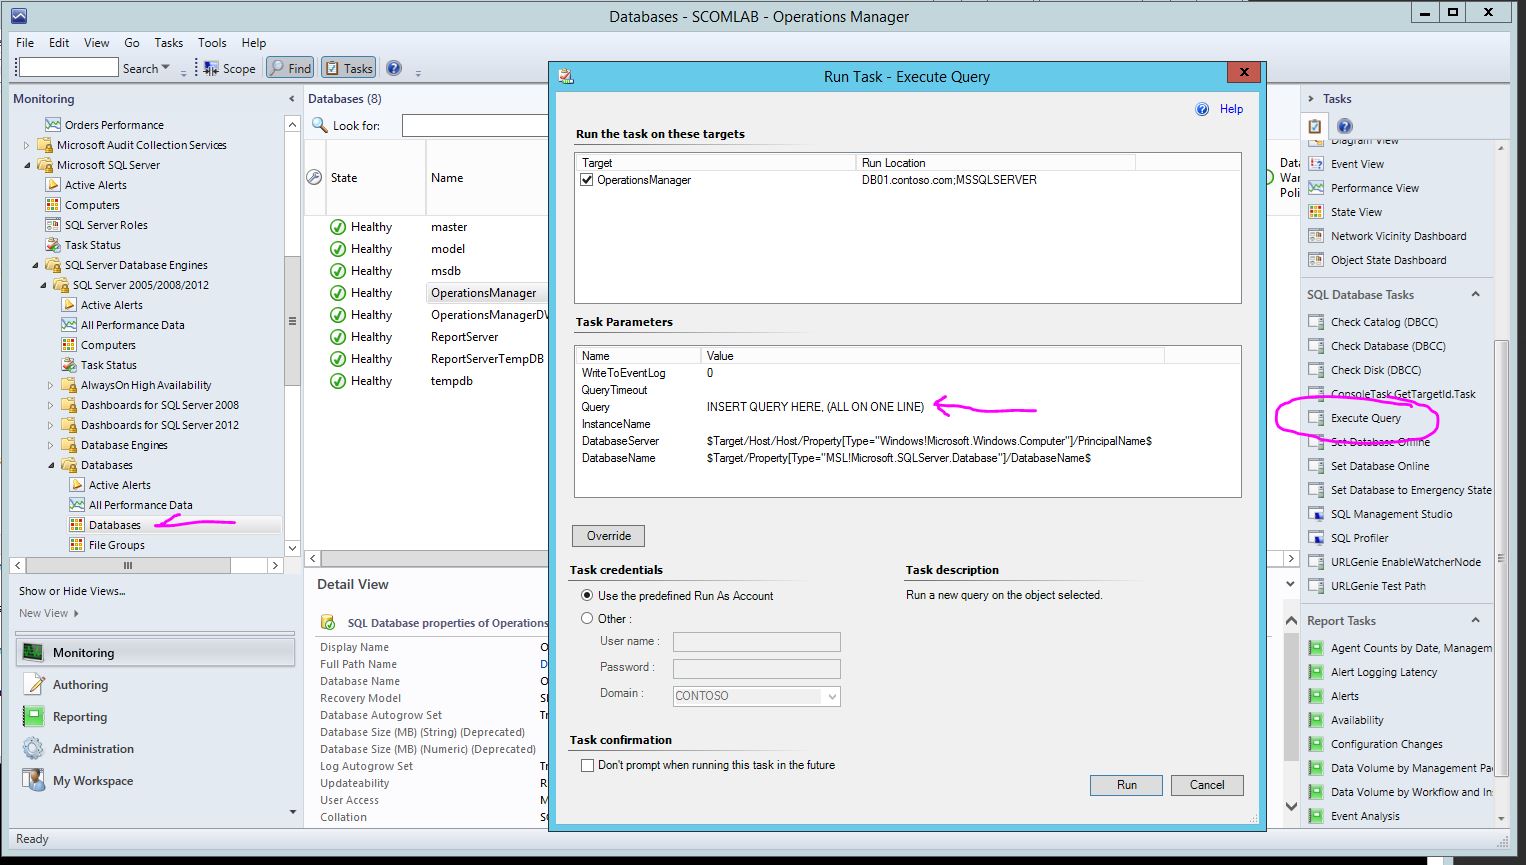
Example with simple query and result metric:
| MP Name | Version | Download | Notes |
| LogGenie | 1.0.0.85 | downoad | |
| SQLServerQuery | 1.0.0.82 | download | Contains datasource for SQL Query |
Page History:
2015-1-4: Updated LogGenie MP. Added "Total" rules. Added link to SQLServerQuery MP.