Hyper-V Storage Analysis
Hyper-V Perfies,
In a previous blog entry I explained the different types of storage choices you have with Hyper-V. However we had nore released yet so no numbers could be published. You can find the original post below...
Now that we have release I wanted to share some numbers from a mid-range storage device.
For the storage performance results below we used;
- A dual core 2GHz system
- 8 SAS disk system configured to run RAID0
- Off the shelf SCSI RAID controller
- We pre-populated the Virtual Hard Disks used with non-zero data to avoid testing an optimization we have were zero block are not actually written to Dynamic / Diff VHDs if they have never been written before.
- IOMeter was used to generate the load and gather results.
- Root results were tested using VHD loopback. This means we used the WMI interfaces in Windows Server 2008 to mount the VHD into the root without any virtual machine. This was pretty close (<1% diff) to bare metal performance (no Hyper-V enabled). Check out this link on how to do it https://blogs.msdn.com/virtual_pc_guy/archive/2008/02/01/mounting-a-virtual-hard-disk-with-hyper-v.aspx
- SCSI and IDE results were collected from a Windows Server 2008 64bit one virtual processor guest.
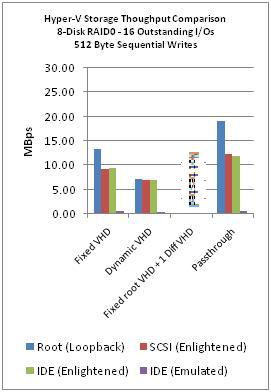
- Only read performance was collected for fixed Root VHD + 1 Diff Disk. This is why some parts of the graphs are label "NOT TESTED". Reads have to traverse the differencing chain and writes go to the outer most disk so write look just like dynamic disk write performance and were not collected.
We chose this configuration because it was pretty low to mid range, would be very low cost, and therefore within reach of all customers running Hyper-V. If you are running Hyper-V with big servers and storage containing 100's of disks you find it handles it very well with very little overhead. That might be the subject of a future post.
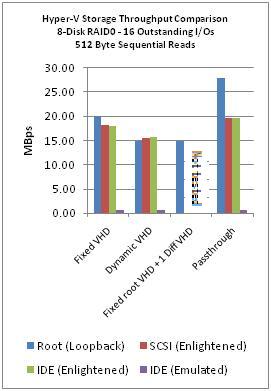
The following graphs show sequential I/O performance of 512Byte reads and writes. We choose this to measure because it would approximate the behavior or loading applications, editing small files, and other types of workloads doing sequential I/O. We saw big improvements with larger I/O's (>4x) but for many workloads those are not that likely to be encountered.
The following graphs show 8KByte random read and write performance. We chose 8KByes reads and writes because many servers such as SQL Server 2008 use this sized I/O for most operations.
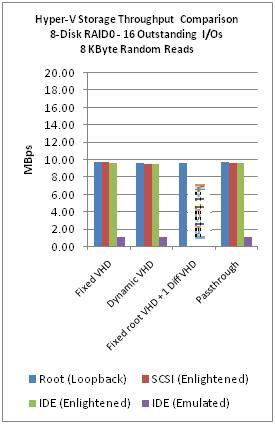
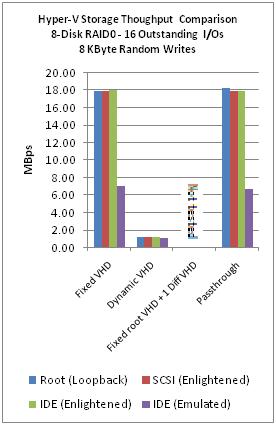
From the graphs you can see that Emulated IDE (aka you are not running with Integration Components installed) is never a good choice.
Passthough followed by fixed disks have the overall best performance. Dynamic and differencing disks are good choices when you need flexibility.
Enjoy,
Tony Voellm
Liang Yang