ANSWER: POP QUIZ: What to do next? - part 1
So we didn't get much more on this one, so I'll go ahead and show how we find out what is going on here. So the loader heap question was a very good thing to check. With the sos.dll that comes with the debugger for 1.x versions, we have some really nice commands we can use. These are the types of commands I was asking if we needed for 2.0 and later here.
The first one we can run to check on things is !dumpdomain -stat. This will print out the number of assemblies that each domain has which can be very useful to narrow down where the problem is as well as if we have a problem. For the dump we are working on here, we see:
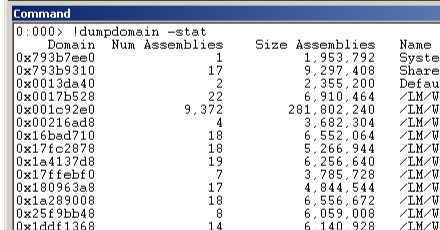
So we can tell that one domain has the issue since it has 9,372 assemblies loaded into it. So digging into what these assemblies are, usually we aren't going to see that many DLLs loaded in a domain, so the first assumption is that it is dynamic assemblies. We talk about this here. In this case, it is caused by dynamic assemblies being created by XML Serialization.
There is more talk about this here. And how to debug into XML Serialization here. And a good followup here.