High Memory part 5 - Fragmentation
So in our previous High Memory posts, we have talked about situations that are all causes of memory to appear high when looking at the process in Task Manager or Perfmon.
But in most situations, you aren't going to be monitoring these tools. So the way you will find out that you are high in memory is that the Web Server will crash and you will see that the exception given was System.OutOfMemoryException.
There are a number of problems that can cause this, as you can probably guess since this is part 5 of the High Memory blogs. So what if when you look at the process, it isn't taking up much memory, but is still giving you the OutOfMemoryException?
Problem 1
Let's take a look at a dump with this as the problem. So first we look at !address -summary as always, but don't see much memory in the Virtual Memory or Native Heaps:
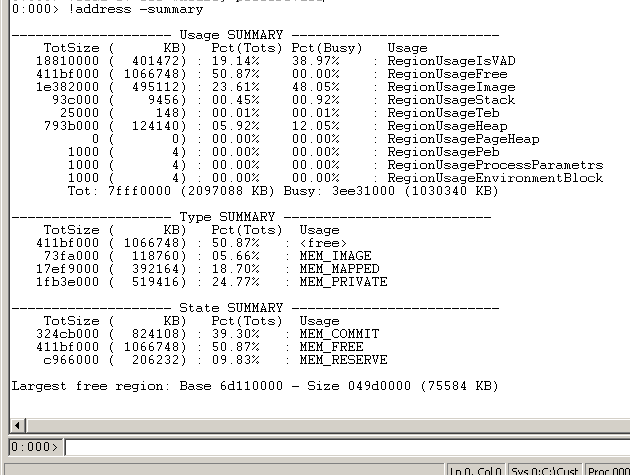
But notice that the RegionUsageImage section is pretty high. This is the area where all of our files are. Like the DLLs and EXEs of the actual process. But if you look at the output from lm, you won't see that much data. So what is going on here? How can we be out of memory, with a lot of memory listed as being images, but list modules (lm) doesn't show that many?
The answer is something we have discussed in the past, Dynamic Assemblies and what to do about them. If we run the same command that is in the troubleshooting section of that post we can see:
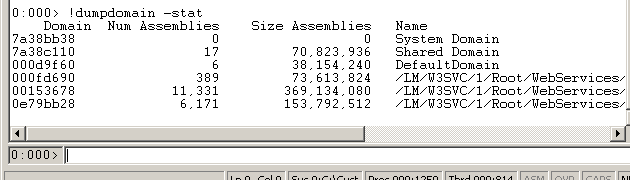
And we can clearly see from this that we have a lot of dynamic assemblies. So now we just follow the same steps as in that previous post to see what they are and reduce the amount of them that we are using.
Problem 2
There is another type of Fragmentation that we could see. That we first mentioned in High Memory part 4. That is high memory in .NET, but when you look at the output of !dumpheap -stat you see something like:
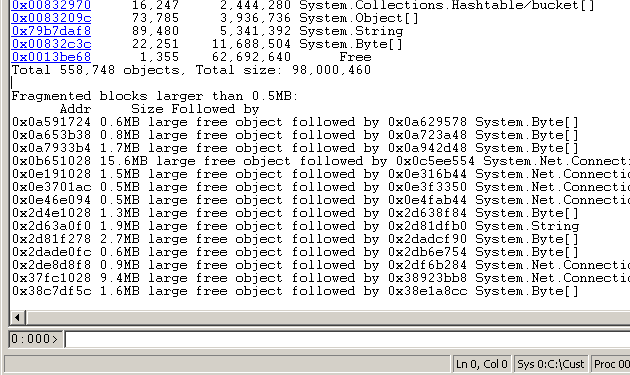
From this we can see that the largest amount of memory is being taking up by System.Free (Free in the list). This is a special object that is used by .NET when an object is no longer being referenced, but we haven't been able to recapture the memory yet. So why haven't we been able to recapture the memory? Well the reason is because of the blocks that are printed below the report. These are the actual Free blocks that are in .NET and the object that is after them is also listed. Theses are typically caused by objects being pinned. There is a very good description of the situation here.
For this particular dump, the fix was to install the hotfix, 831138.