PDC10: Mysteries of Windows Memory Management Revealed: Part Two
In the last session, focusing on virtual memory, it was noted that there was almost no connection between virtual and physical memory. The only connection is that the system commit limit is the sum of physical memory and the size of the paging file(s). This session focuses on the physical memory aspects of the memory management architecture in Windows.
Physical Memory and Working Set
The working set is the physical memory that Windows gives to your process, given to you when you demand it by touching the virtual address space. A process starts with an empty working set – as it references pages that aren’t in the working set, it incurs a page fault. Many such page faults are resolved simply from memory (for example, if you load an image that is already in the file cache).
Each process has a working set default minimum and maximum. Windows doesn’t pay any attention to the maximum working set; Windows uses the minimum to commit that amount of memory, as well as to lock memory.
At some point, the memory manager decides the process is large enough; it then gives up pages to make room for new pages. If your process is ballooning, the memory manager will tend to favor it because it is obviously memory-hungry; but at some stage, it will start to pull pages out of the working set that are least recently used before it will allocate new memory to that process.
Unlike other OS, it is a local page replacement policy, meaning that it will pull the pages from the requesting process.
The working set consists of shareable and private pages; there are performance counters that measure this. Shareable working set is effectively counted as “private” if it is not shared. Note that the working set does not include trimmed memory that is still cached.
Windows Task Manager only offers the private working set figure; Process Explorer gives you a more detailed view. Remember – it’s only when you touch the memory that is committed that it becomes part of the private working set. Comparing testlimit with –m, –r and –d switches demonstrates the differences here.
Physical Memory Page Lists
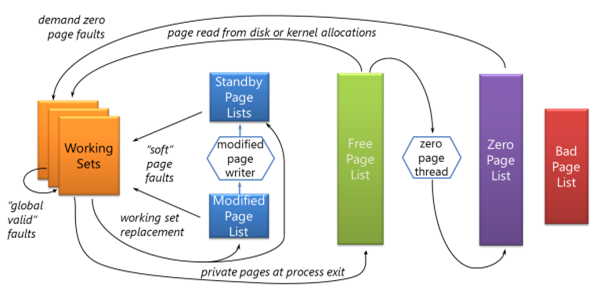
The system keeps unassigned physical pages on one of several page lists in the Page Frame Number (PFN) database, each maintained as FIFO list:
- free (available for allocation but has dirty data in it);
- modified (previously belonging to a process but needing to be written to a backing store before it can be reused;
- standby (still associated with a process but not included in the working set);
- zero (zeroed out memory safe for allocation),
- ROM (read-only memory)
- bad (pages that failed internal consistency checks).
Note that meminfo gives you a way to investigate these page lists: Alex Ionescu provides further helpful commentary on the tool on his blog.)
When Windows starts, all memory is in the free page list. As a process demands memory, it is faulted in from the zero page list (however, the free page list can be used if the memory is to be used for a mapped file, since the data will be overwritten before the process sees it). If a page is pulled from a process, it may be moved to the modified or the standby page, depending on whether it contains private data that needs to be flushed or not. When a process exists, its pages are moved to the free page list.
There are two threads that are specifically responsible for moving threads from one list to another. Firstly, the zero page thread runs at the lowest priority and is responsible for zeroing out free pages before moving them to the zeroed page list. Secondly the modified page writer is responsible for moving pages from the modified page list to the standby page list, first writing out any data.
What happens if the zero and free pages are exhausted? The memory manager starts using the standby page list; if that is exhausted, then the modified page list can be used (once the modified page writer has flushed the content and moved it to the standby page list). If all these pages are exhausted, the last resource is to remove memory from the working set.
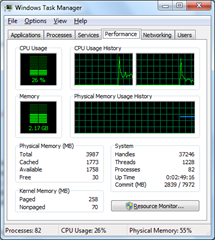
 With this information, we can more helpfully interpret the data provided by Task Manager.
- The Available field (right) shows all the pages in the zero, free and standby lists.
- The Cached field shows all the pages in the standby and modified page lists as well as the system (kernel) working set.
- The Free field shows just those pages in the free and zero page lists.
Rammap is another useful tool, showing the most detailed breakdown of what’s going on in RAM at the time it takes the snapshot. It breaks down all the memory in the system by type and page list. For processes, it shows the private working set for each process as well as memory for that process on the standby or modify page list as well as kernel memory in the page table.
As you can see, having a low “free memory” value in Windows is normal – and a good thing. In fact, a technology like SuperFetch has the goal of reducing free memory (moving pages from the free to the standby list as it caches files into memory).
SuperFetch is used to proactively repopulate RAM with what it believes is the most useful data: it takes into account the frequency of page usage, and the usage of the page in the context of other pages in memory. Interestingly, the choices it makes are also influenced by a time-based heuristic – it understands that users launch different applications at the weekend than during the weekday, and at the evening than the daytime. SuperFetch is disabled in Windows 7 if the operating system is booted from an SSD drive, because the primary benefit is to reduce random read seeks on a platter-based hard drive.
It’s worth noting that there are actually eight standby page lists in practice on Windows Vista and above; this is used to ensure that the least important standby pages are scavenged first. (Rammap can show you how much memory has been repurposed from each of the standby priority lists.)
A common question: do you have enough RAM in your system? There’s actually no sure-fire way to tell if you have enough memory. If available memory is low for a considerable length of time, then you probably could use more. You can check Process Monitor to see if there are an excessive number of reads from the paging file (there’s no performance counter for paging file reads).
Mark closed with some examples of how certain memory usage can be hard to or inspect or detect: a shared memory leak, large quantities of reserved but uncommitted memory, locked memory, driver locked pages and AWE pages.
[Session CD02 | presented by Mark Russinovich ]
