Where Did Application Insights Put my Performance Counter Data?
I ran into an issue finding performance counter values I had pushed to Application Insights and wanted to note it to save others some time.
You can configure Azure Diagnostics (WAD) to push diagnostic and performance data to Application Insights:
/en-us/azure/monitoring-and-diagnostics/azure-diagnostics-configure-application-insights
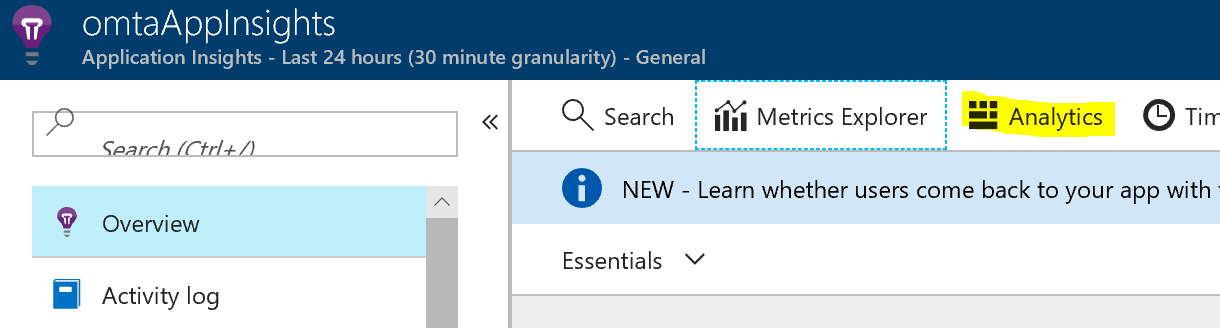
Once you configure WAD to sink data to Application Insights, you can go into your Azure Subscription Portal, click on the instance of Application Insights that you have set up, then click on the Analytics button to get a very powerful ability to query all the incoming diagnostic data:
As the data comes in from WAD, it is routed by Application Insights to different 'tables', which are listed in tree form as child nodes under the parent node 'APPLICATION INSIGHTS'. You can then query these tables to see the data:
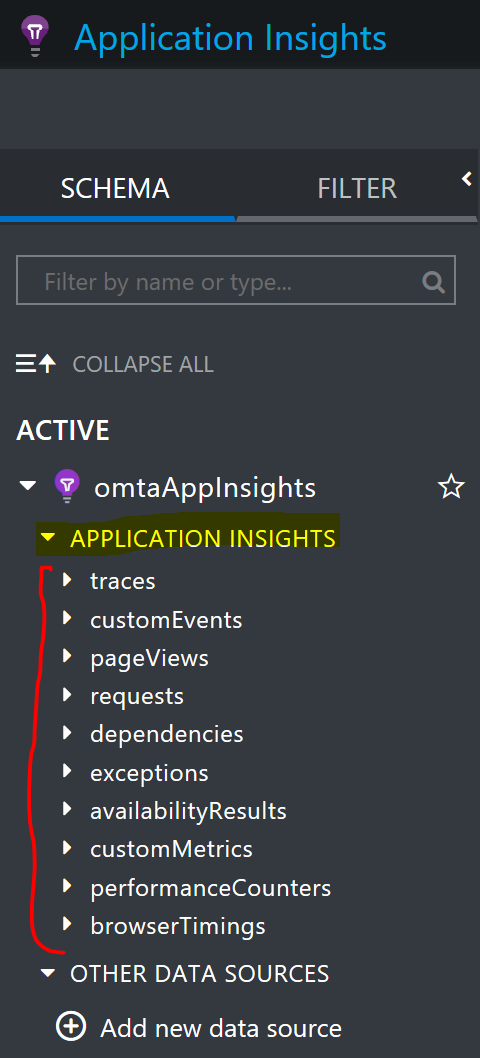
I had designated several performance counters to be captured by WAD and sent to Application Insights. Naturally, I assumed that I would find them in the table named performanceCounters (see above picture). However, I only found some of them showing up there, one of which was % Processor Time. I didn't know what happened to others and thought I had misconfigured WAD.
After some investigation, I found out that for legacy reasons, some performance counters are forced by Application Insights to the performanceCounters table. All other counters go to the customMetrics table.
As best as I could determine after speaking with various people, here is a list of counters that are routed by Application Insights to the performanceCounters table:
@"\Process(??APP_WIN32_PROC??)\% Processor Time",
@"\Memory\Available Bytes",
@"\ASP.NET Applications(??APP_W3SVC_PROC??)\Requests/Sec",
@"\.NET CLR Exceptions(??APP_CLR_PROC??)\# of Exceps Thrown / sec",
@"\ASP.NET Applications(??APP_W3SVC_PROC??)\Request Execution Time",
@"\Process(??APP_WIN32_PROC??)\Private Bytes",
@"\Process(??APP_WIN32_PROC??)\IO Data Bytes/sec",
@"\ASP.NET Applications(??APP_W3SVC_PROC??)\Requests In Application Queue",
@"\Processor(_Total)\% Processor Time"
All other counters are routed to the customMetrics table. There does not appear to be any configuration option to change where Application Insights routes the data, so I wanted to let those interested know that they'll need to query both the performanceCounters and customMetrics tables to retrieve performance counter values.