Steps to check the code coverage of a web application via command line
We were working with a customer who wanted to do a code coverage analysis of his web application outside of unit test.
He wanted to profile his web application on the IIS server, for the percentage of code executed using visual studio performance tools.
We created a document on how-to for the customer and thought would be a good idea to publish it to the team blog, for wider audience.
I am assuming that the following pre-requisites are satisfied
· Visual Studio Premium is installed on the IIS server ( to get performance tools)
· A Visual Studio solution (a web application) is already there with you
Step 1:
Deploy the IIS website, from visual studio to your server. I am using Visual Studio publish to my server. Let’s call it Venkat-Server, on the port 80 default website. I am using my own account to run the application pool for the website.
Step 2:
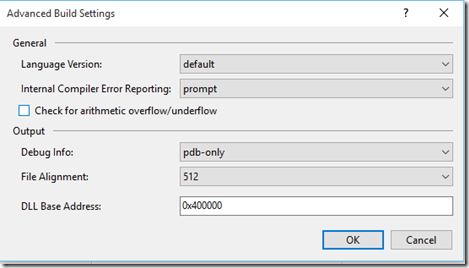
We need to copy the PDB file of the assembly we are planning to profile to the IIS server, in the location of the website path. If you don’t see the PDB file getting generated you can do this to generate the PDB file as a part of the build
· Right click on the project inside visual studio -> properties
· Go to Build
· Click on Advanced
· Under output check the Debug-Info dialog box
· I have set it to PDB-Only, to generate the PBD files.
You can copy the PDB from the build location on your local Visual Studio machine and put it inside the web site directory or can ask Visual Studio to publish the PDB along with the web site. For the first, do a local build, go to the project location in the file explorer and check for the PDB in the bin.
If you want the publish to copy over the PDB files, you can do the following
· Right click on the project inside visual studio -> properties
· Go under Package/Publish Web
· Uncheck Exclude generated debug symbols, if it’s checked
· Start a new publish from visual studio.
At the end of this step, you should have the website published on the IIS server and the PDB file for
the DLL we want to profile should be preferably in the same location as the DLL itself.
I have my website it the default location “C:\inetpub\wwwroot”. I have the DLL MyWebsite.dll in “C:\inetpub\wwwroot\bin”, and along with that I have MyWebsite.PDB in the same location.
Step 3:
Open a command prompt as an administrator on the IIS server. Go to the location – “C:\Program Files (x86)\Microsoft Visual Studio <>\Team Tools\Performance Tools”.
Run the command - vsperfclrenv /globaltraceon
Then reboot the IIS server
Step 4:
Open a command prompt as an administrator on the IIS server. Go to the location – “C:\Program Files (x86)\Microsoft Visual Studio <>\Team Tools\Performance Tools\x64”.
I am going with x64 because my application pools are 64 bit.
Run the command – vsinstr /coverage <location of the assembly>
Example - vsinstr /coverage C:\inetpub\wwwroot\bin\MyWebsite.dll
The syntax is - The successful output should be something like this
File to Process:C:\inetpub\wwwroot\bin\MVCWebAPI.dll --> C:\inetpub\wwwroot\bin\MyWebSite.dll
Original file backed up to C:\inetpub\wwwroot\bin\MyWebsite.dll.orig
Successfully instrumented file C:\inetpub\wwwroot\bin\MyWebsite.dll.
If you are missing the PDB file you would see something like this
Error VSP1030: Invalid, mismatched, or no PDB file was found for C:\inetpub\wwwroot\bin\MyWebsite.dll
Step 5:
Run this command - vsperfcmd /START:COVERAGE /OUTPUT:<outputfile> /CS /USER:<Identity of the application pool>
Example - vsperfcmd /START:COVERAGE /OUTPUT:venkat.coverage /CS /USER:"domain\venkat"
Step 6:
Attach the application pool by running the command - vsperfcmd /ATTACH:<process>
Example - vsperfcmd /ATTACH:w3wp.exe
I am able to run this, as this is the only application pool running on my server.
If you have many you can run with the process id of the w3wp.exe, that you can find from task manager.
Step 7: Go ahead and make the calls to the web application
Step 8: Once you are done with the calls, run this command to detach the applications that are being monitored- vsperfcmd /DETACH
Step 9: Stop the application pool that you are using - iisreset /STOP
Step 10: Shut the data collection with this command - vsperfcmd -SHUTDOWN
You should see the output file have coverage data. You can open this with Visual Studio.
As always if you are interested in trying this – you can try at your risk and in your free time ![]()
Content created by – Venkata Narasimhan
