.NET Performance Issues: What if I suspect that my performance problem is in SQL Server Part II
Last week Graham was guest blogging on my blog about PSSDiag and how to gather data with PSS Diag. In this second installment he talks about how to read and understand the data.
Graham is in the process of starting his own blog about how to troubleshoot different SQL issues. As soon as it is up and running I will post a link.
In the meantime, enjoy!
Part 2: Reviewing the data
First off - an addition to Part 1. One of my colleagues in the US has posted the internal performance statistic T-SQL script which we use to capture all sorts of data from the SQL Server DMVs. This script doesn’t install by default with a standard SQL Server setup like the rest of SQLDIAG, but you can obtain the script and download it from the SQL Server Engineers blog here. He also helpfully provided an XML config file with all the required entries to make it run. I found the easiest way to deploy it in a default install of SQL Server was to unzip the 2 SQL scripts and the 2 XML files into the directory where sqldiag.exe lives, as shown in part 1. You can then simply run the same diagnostics as I showed you, but include these extra T-SQL scripts, by running something like this:
sqldiag /ISQLDiagPerfStats_Trace.XML /Oc:\sqldiag
Although you can also use the cmd files he provided for registering and running as a service. Either way you get 3 extra text files in the output. Now back to part 2…..
First off it would be remiss of me not to mention SQLNexus. This is a great tool written by several Microsoft Engineers and allows automated processing and review of the output of SQLDIAG and PSSDIAG. It has some great features and is very well documented so I don’t propose to duplicate that here. Suffice to say that you can download it here:
https://www.codeplex.com/sqlnexus
The tool will often be able to pinpoint problems for you, and if you’ve collected the data as we detailed before you can just follow the documentation and see what it tells you.
However there’s no hard and fast way to diagnose SQL Server performance issues, and therefore sometimes it’s hard to know where to start. Sometimes the automated tools won’t be able to jump straight to the answer, and I’m a fan of understanding what’s really happening and being able to look at it myself. Therefore the rest of this article details some basics of performance data analysis you can do yourself. Each of these topics can be expanded to several posts all to itself, so these are just meant as entry points for the troubleshooting thought process. There’s lots more detailed information on all of them through various Microsoft resources. This post assumes you are running SQL Server 2005 with Service Pack 2.
Are there SQL batches that actually run for a long time?
This is a good question to start with. If there aren’t any SQL batches or objects which do actually run for a long time, then maybe you ought to be looking elsewhere for your problems. (there’s obviously always an exception to such a statement but that’s for another time…)
So if you’ve enabled the SQL Profiler options within SQLDIAG, you’ll have a .trc profiler trace output file (or maybe more than 1 if you left the collector running for a long time). You can review these to see if there are long running queries. If you open up the files in the SQL Profiler GUI you can browse through the results, looking for queries that take a long time. You can also apply filters to cut down the results, and then you might just come across something like the following
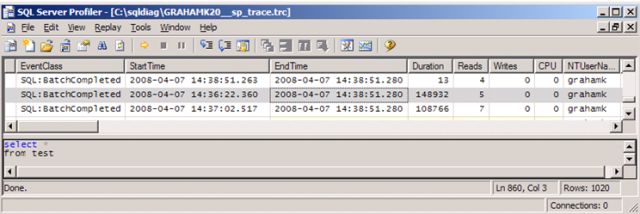
Here you can see a query where the text was “select * from test” and it took 148932ms to complete. I can see who ran it, from what application and how many reads, writes and CPU it spent. There are further columns off the screen here, but I can already tell that this definitely looks like a problem.
OK, so obviously no-one wants to scroll through hundreds of MBs of trace files (even with filtering), but this technique just demonstrates that the data is there. What we really need is an automated way of doing it, so try the following:
Use the fn_trace_gettable function to import the trace files into a SQL Server database. For example:
 use test
go
SELECT * INTO trace_data
FROM ::fn_trace_gettable('c:\sqldiag\GRAHAMK20__sp_trace.trc', 1)
Now we have all the data in a database table. So now you can write some very simple SQL to get out details of any bad performing code, which you can then examine further. For example:
 use test
go
SELECT *
FROM trace_data
WHERE Duration > 1000000 --value in microseconds for SQL 2005
AND EventClass != 137
ORDER BY Duration desc
This will get you a list of any long running batches which you can now look at further. (The “AND EventClass != 137” just removes an event which we’re not interested in at this stage). The point here though is that you can now write simple T-SQL statements to do all the work for you.
You can also use the same theory of importing the data into a database and writing queries against it, by using the import features of SQLNexus, or by using the readtrace tool from the RML utilities download. These tools contain their own documentation about the database structures and usage.
The bottom line here is that if you review your data, and every SQL batch completes in less than 15ms, then as I said, maybe you should be looking elsewhere.
Further Reading: Viewing and Analyzing Traces with SQL Server Profiler
Is there blocking in the database
There are 2 ways of looking for this principally (excluding SQLNexus which also does it)
1. Review the output from the Performance Statistics script
Search for the case sensitive text string “-- BLOCKING DETECTED –“ and you will potentially find reports such as these (reformatted here for publishing)
 -----------------------
-- BLOCKING DETECTED --

-- headblockersummary --
Runtime: 2008-04-07T14:38:08.953
head_blocker_session_id: 53
blocked_task_count:2
tot_wait_duration_ms: 173062
blocking_resource_wait_type:LOCK BLOCKING
avg_wait_duration_ms: 86531
2. Review the blocked process report in the SQL Profiler output (if enabled)
EventClass 137 (Blocked Process Report) creates XML output containing all the above information (and much more) which you can process in the method of your choosing.
Further Reading: Understanding and Avoiding Blocking
Are there any problems in the configuration options of SQL Server
Everyone’s server needs to be configured differently, but there is an option in the server configuration options which sometimes people enable when they probably shouldn’t. You can review the server configuration options either in the GUI of SQL Server Management Studio, or through the output of the sp_configure stored procedure. The latter is shown in the text file output from SQLDiag in the file.
The option is called Priority Boost and it changes the priority of the SQL Server process within the scheduling routines of Windows. It is off by default and should remain as such unless you have a specific reason to turn it on. If you are experiencing CPU bottlenecks or strange CPU related wait types, then check if this is enabled first. Also as you will note from this article, you definitely should not enable it if you have a clustered installation. There is a classic mistake here where people want their SQL Server to run faster, so they just enable this option.
Further Reading: How to determine proper SQL Server configuration settings
Is there a disk IO problem
SQL Server is an IO dependent application and if the IO sub-system is not working optimally then it’s impossible for SQL Server to work optimally. As with many situations this in itself is a huge topic, but if you want to check something quickly, try the following:
Perfmon Counter: Physical Disk (or logical disk) Avg. Disk secs/read.
We use the following values as a rough guideline for this counter:
0.005 or below: excellent
0.005 to 0.010: good
0.010 to 0.015: acceptable
Above 0.015: potential problem
If you have numbers consistently in this outer range you may notice slow performance on your SQL batches. If you have number massively outside of this range, you might want to check the health of your disk system.
If your disk system appears healthy, but still slightly slow, then you could consider reducing the load on it by identifying expensive IO batches from your profiler data, and trying to tune them to reduce this load. For example, consider the earlier query that I wrote to identify long running SQL batches. I could change it to something like the following and look for batches that were expensive in IO terms.
 use test
go
SELECT *
FROM trace_data
WHERE Reads > 1000
ORDER BY Duration desc
You can also check the SQL Server error logs for the following message, which indicates that SQL Server IO times have been experienced that are a factor of 1000 longer than they should be. You might be surprised how often we see this message in support. You should always look for this:
 2008-04-07 05:13:31.650 spid2s       SQL Server has encountered 1 occurrence(s) of I/O requests taking longer than 15 seconds
to complete on file [C:\Program Files\Microsoft SQL Server\MSSQL.1\MSSQL\Data\blog.mdf] in database [blog] (5).
The OS file handle is 0x0000000000000760.
The offset of the latest long I/O is: 0x0000031bea2000
If you see these errors you should address them immediately with hardware support (and you should also run a DBCC CHECKDB as soon as possible to ensure that you haven’t got any corruptions in your databases.)
Errors like the above are often accompanied by errors like this in the system event log (obviously the exact format depends on your hardware and the type of problem, but the point here is that windows is trying to tell you something is up with your hardware)
 2007-03-07 09:53:37,Warning,0,24683,MACHINENAME,XXXXXX,"SCSI bus fault occurred on Storage Box box 0, , Port 1 of Array
Controller [Embedded]. This may result in a downshift in transfer rate for one or more hard drives on the bus."
Further reading: SQL Server I/O Basics, Chapter 2
Are there any indications of memory problems?
Once again, this is a huge topic, but here are some quick indicators which you can check:
Perfmon Counter: SQLServer:BufferManager Page Life Expectancy
As a guideline we look for this counter to be above 300 (measured in seconds). This counter indicates how long a cache page resides in the buffer pool before it is aged out. The reason that high values are good is that this means your buffer page access will be to and from memory as opposed to from physical disk, meaning that as a rule they can be much faster. If it’s under this you will be placing more load on your disks by increasing IO requirements.
You might need to add physical memory, but it’s far more likely that you have large amounts of non-optimized code which are filling up the buffer pool regularly and forcing data to be aged out quicker than necessary.
Have you seen any of these errors in the SQL Server log:
 2008-02-27 16:16:52.560 spid1s A significant part of sql server process memory has been paged out.
This may result in a performance degradation. Duration: 1201 seconds.
Working set (KB): 105904, committed (KB): 239976, memory utilization: 44%.
If you see this message then you can tell that SQL Server is being forced to page out its memory, which as the message says, can cause performance degradation. There are a number of conditions under which this situation can occur, and this article details some of them.
Further Reading: How to use the DBCC MEMORYSTATUS command to monitor memory usage on SQL Server 2005
In Summary
We touched upon a few basic techniques for investigating potential SQL Server performance issues. Hopefully some of them will allow you to isolate issues to particular pieces of your application architecture. If the issues are of interest to you, or you’re interested in more details on any of the points raised, you could begin by reading some of the following resources:
Troubleshooting Performance Problems in SQL Server 2005
SQL Programmability & API Development Team Blog