SharePoint 2010 Performance Dashboard - Server Performance Reporting(Post 2/2)
Continuing from the Post 1,
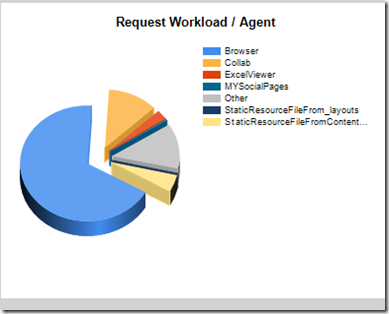
Request Workload / Agent
Query :
 SELECT
         AgentName, SUM(RequestCount) AS RequestsCount
 FROM
         RequestWorkload
 WHERE
         (LogTime BETWEEN GETDATE() - 10 AND GETDATE())
         AND
         (AgentName IN ('Browser', 'Collab', 'ExcelViewer', 'DAV', 'Groove14', 'Excel14', 'Word14'))
 GROUP BY
         AgentName
 ORDER BY
         RequestsCount DESC
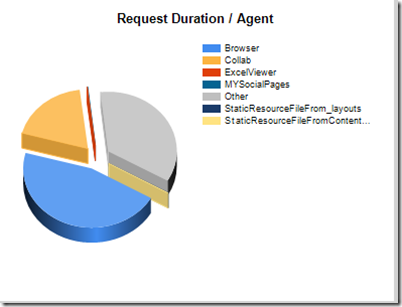
Request Duration / Agent
Query :
 SELECT
         TOP (10) AgentName, SUM(Duration) AS Durations
 FROM
         RequestWorkload
 WHERE
         (LogTime BETWEEN GETDATE() - 10 AND GETDATE())
         AND
         (AgentName IN ('Browser', 'Collab', 'ExcelViewer', 'DAV', 'Groove14', 'Excel14', 'Word14'))
 GROUP BY
         AgentName
 ORDER BY
         Durations DESC
UI & Packaging
For UI, I have used SQL Reporting services since I wanted to make this as a web based solution rather than any thick client application so it can be accessed by anyone(based on the permissions) at any place. I created a project using SQL Server Business Intelligence Development Studio and hosted it in SharePoint. For setting up reporting services with SharePoint, please refer Configuring Reporting Services for SharePoint 2010 Integration.
Also, You may use any of the other methods for reporting like, SharePoint chart controls, Business Connectivity Services(BCS), Custom web parts using ASP.Net chart controls etc…
Thank you for Reading!

