Analyzing page view logs using Pig on Windows Azure HDInsight
In this article, I would like to take you through the steps to run your first Pig script on a significant dataset, using the new public preview of Windows Azure HDInsight, our distribution of Apache Hadoop made available as a service in the Cloud.
The Dataset
First, let's discuss the dataset: I think Pig is particularly well suited to analysis of log files, where the structure is not always very formal and where Pig's flexibility really makes our life easier. I chose to use a publicly available dataset, Wikipedia's "Page view statistics for Wikimedia projects", which contains hourly dumps of page view counters for all of Wikipedia's projects. The page describes the dataset and how it is built, but here is a little extract of one of the log files, pagecounts-20130401-000000.gz:
 fr Paris 100 15325959
fr Paris_en_chansons 2 92560
fr Paris_quadrifolia 1 16023
fr Paris_qui_dort 1 9933
fr Paris_sous_les_bombes 1 15323
fr Paris_va_bien 1 11360
fr Parisianisme 2 21184
fr Parisii 1 15944
As you can see, the logs are in a simple ASCII format. This snippet means that on April 1st 2013, during the first hour in the day (you get that bit from the file name), there were in the "fr" Wikipedia project, 100 views for the page for "Paris", 2 views for "Paris en chansons", etc. The last number is the total bytes sent.
Let's say we want to do some analysis of the page views on Wikipedia on April 1st and maybe see what good pranks were going on around the world! In order to have a full view of the traffic for that whole day we need to analyze all the logs for that day, which represents 24 gzipped files, containing 160 millions lines for a total of 7+ GB uncompressed data.
This is not a huge dataset, but it is significant enough to allow us to utilize the HDInsight cluster. And once we have a working analysis for this dataset, we can reuse the exact same method to run on a bigger sample, for example a full month, and scale our HDInsight cluster accordingly in order to get our results faster!
So, let's review all the steps needed to run our analysis.
Create a storage account
HDInsight gives you the option to use Windows Azure Storage to store your data. This is very useful in the case of ephemeral Hadoop clusters, because it will leave the data intact even when you delete the cluster; you can then choose whether you want to keep the data around to run more analysis jobs later, or if you would rather delete the data in order to save on storage costs.
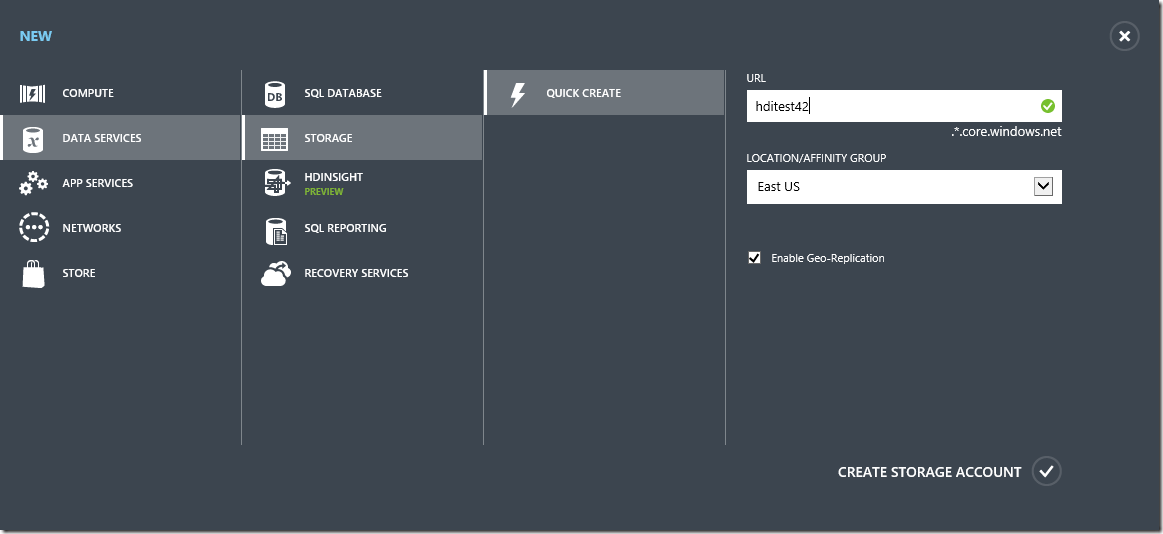
To create a storage account for your HDInsight cluster, log into the Windows Azure Management Console, choose New, Storage, Quick Create, and just choose a unique DNS prefix for your account. Please note that if you are using the Public Preview of HDInsight, you will need to create your account in the "East US" region.

Create the HDinsight cluster
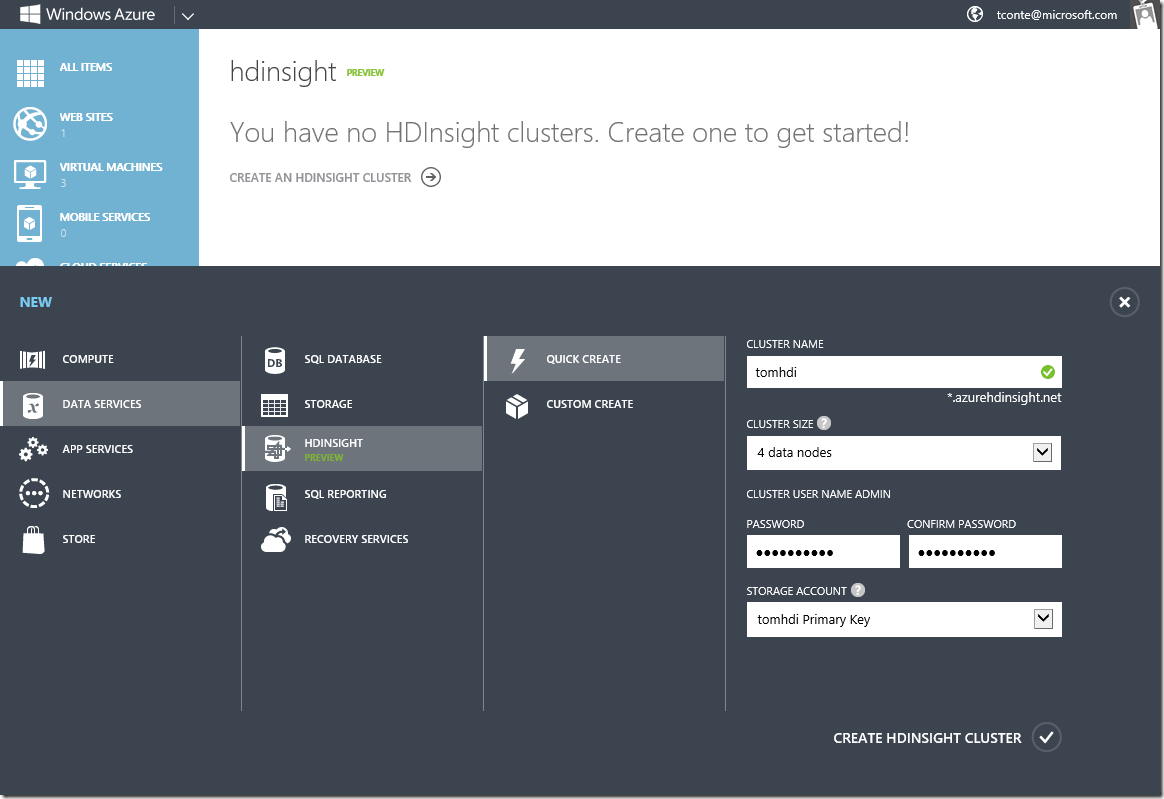
Now that you have a storage account for your data, you will need to create the actual HDInsight compute cluster. This is not a terribly difficult task: just go to New, Compute, HDInsight cluster, Quick Create, and just fill in the options: cluster DNS prefix, number of nodes (4 in our example), and a very secret administration password.

Once you click the OK icon, the cluster will go through several stages before it's fully operational, and this could take a few minutes; here is the final status you should see in the console:

Connect to the head node
Now that your cluster is up and running, there are a few things you can do directly from the Web management console. However, the best way to play around with Hadoop is probably to drop to the command line, and you can do that by connecting to the Head node via RDP: just click on the Connect button at the bottom of the HDInsight page on the Windows Azure Management Portal. Use the admin credentials you used when creating the cluster.
Once you are logged on the Head node, you will find a few shortcuts placed on the Desktop:
- Hadoop Command Line
- Hadoop MapReduce Status
- Hadop Name Node Status
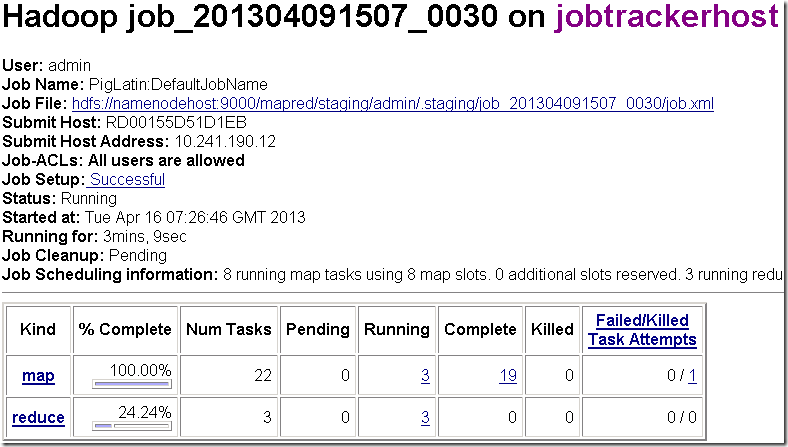
The first you can try is double-click on the "Hadoop MapReduce Status" to open the status Web page. CLicking on the JobTracker link will take you to the page you can use to track the progress of running jobs.
To enter the Hadoop command line, double click on the "Hadoop Command Line" shortcut. A friendly help message will appear and leave you with a blank command line. Here you can start playing with HDInsight and get your bearings.
Now that we are reading to do some work, let's see how we can get our data into the system.
How to download the data efficiently!
There are many ways to import data into the HDInsight cluster in order to work with it. In the default configuration, HDInsight is configured to use Windows Azure Storage, which means that we could use any storage explorer tool (like Cloud Storage Studio or CloudXplorer) to upload data in the storage account we created above.
However, because I am located in Europe and both my source data and the HDInsight cluster are located in the United States, I am going to try and optimize the download times by retrieving the data directly from the Head node (which should be reasonably fast since I am at least downloading from the same continent!) and then copy the data from the Head node to Windows Azure Storage, which will be very fast because they are located in the same data center.
Before we start downloading, just take a quick look at the disk configuration for the Head node: as you can see, you will find most of the available node storage in the C: drive, which has around 2 TB of free disk space. This is probably the right place to use as temporary storage for our data files!
Run Notepad on the server and just copy/past the following PowerShell script, then save it e.g. in C:\TEMP\GetFiles.ps1 (create that directory first if it doesn't exist).
 $wc = New-Object System.Net.WebClient
foreach ($i in 0..23) {
    $n = "{0:D2}" -f $i
    echo $n
    $url = "https://dumps.wikimedia.org/other/pagecounts-raw/2013/2013-04/pagecounts-20130401-" + $n + "0000.gz"
    $wc.DownloadFile($url, [System.IO.Path]::Combine($pwd.Path, $url.SubString($url.LastIndexOf("/")+1)))
}
This script will proceed to download in the current directory all 24 files from the Wikipedia dumps Web site, for the 1st of April; of course you can easily change the script to download another day if you prefer. I have found that sometimes there are missing hourly files, in which case the download will fail with a 404 error; you can ignore these, it just means that we will be missing some information for a given day.
To use the script, run PowserShell using the shortcut in the default Windows Server task bar. Then create a subdirectory in C:\TEMP (e.g. "wp0401") and run the script from there:
 PS C:\TEMP> mkdir wp0401
PS C:\TEMP> cd .\wp0401
PS C:\TEMP\wp0401> ..\GetFiles.ps1
Using Grunt
Now that we have downloaded our source data, let's use Grunt, the interactive shell interface to Pig, to copy our source data into the Hadoop cluster so we can run jobs on it. From the Hadoop command line, change to the Pig directory and run Pig:
 c:\apps\dist\hadoop-1.1.0-SNAPSHOT>cd ..\pig-0.9.3-SNAPSHOT
c:\apps\dist\pig-0.9.3-SNAPSHOT>.\bin\pig.cmd
2013-04-11 14:38:49,966 [main] INFO  org.apache.pig.Main - Logging error messages to: C:\apps\dist\hadoop-1.1.0-SNAPSHOT\logs\pig_1365691129964.log
2013-04-11 14:38:50,260 [main] INFO  org.apache.pig.backend.hadoop.executionengine.HExecutionEngine - Connecting to hadoop file system at: asv://myhdi@tomhdi.blob.core.windows.net
2013-04-11 14:38:51,068 [main] INFO  org.apache.pig.backend.hadoop.executionengine.HExecutionEngine - Connecting to map-reduce job tracker at: jobtrackerhost:9010
The informational message confirms that Pig is now connected to our Windows Azure Storage account; you can interact with it using the usual Hadoop commands as available from Grunt, e.g. ls, cd, mkdir, etc. For example, in order to copy all our data from C:\TEMP\wp0401 where we downloaded it, you can run something like:
grunt> copyFromLocal C:\TEMP\wp0401 .
This will copy the whole directory (it will take a little while), and you can check everything is there like this:
 grunt> ls
asv://myhdi@tomhdi.blob.core.windows.net/user/admin/.Trash      <dir>
asv://myhdi@tomhdi.blob.core.windows.net/user/admin/wp0401      <dir>
grunt> ls wp0401
asv://myhdi@tomhdi.blob.core.windows.net/user/admin/wp0401/pagecounts-20130401-000000.gz<r 1>   89406292
asv://myhdi@tomhdi.blob.core.windows.net/user/admin/wp0401/pagecounts-20130401-010000.gz<r 1>   81022448
asv://myhdi@tomhdi.blob.core.windows.net/user/admin/wp0401/pagecounts-20130401-020000.gz<r 1>   83019186
The "ASV" prefix means that the files are stored in Windows Azure Storage, which means that it will stay there even after you shut down the HDInsight cluster.
The Pig script
And now let's look at the Pig script we are going to run!
Actually, Grunt lets you run Pig jobs interactively, which means that you can copy/paste each line in the command window and thus build the script gradually. Pig will not really execute each line when you enter it, but it will build its processing pipeline, and it will only start the process once it reaches the final "store" statement.
Typically, if you want to run a quick test to have a look at the results, and validate or tweak your processing, you are not going to run the script on the complete dataset but on a sample, for example in our case we could use just one file instead of all 24 files for one day.
 records = load '/user/admin/wp0401/pagecounts-20130401-*.gz' using PigStorage(' ') as (project:chararray, page:chararray, requests:int, size:int);
filtered_records = filter records by project == 'en';
records_by_page = group filtered_records by page;
sum_pages = foreach records_by_page generate group, SUM(filtered_records.requests);
result = order sum_pages by $1 desc;
result_limit = limit result 100;
store result_limit into 'wp_april_1st';
This script will produce the result we are looking for, i.e. the most popular English language pages on Wikipedia on April 1st. Let's read it line by line!
records = load '/user/admin/wp0401/pagecounts-20130401-*.gz' using PigStorage(' ') as (project:chararray, page:chararray, requests:int, size:int);
This first statement is our LOAD command, where we instruct Pig while files to read, and how to parse them. In this case, the fields are separated by space characters, and we just have three fields: the "Wikipedia project", which also gives us the language, the page name, the number of requests within the hour, and the total bytes sent for that page. As you can see, we can give names to these fields, and assign them a data type like "chararray" (string) or int.
filtered_records = filter records by project == 'en';
The FILTER statement is used, you guessed it, to filter our records. Here, we only keep records from the main Wikipedia project in English.
records_by_page = group filtered_records by page;
Now, because we want to aggregate all the requests per page, we GROUP the records using the "page" field.
sum_pages = foreach records_by_page generate group, SUM(filtered_records.requests);
The FOREACH directive is used to create a projection of our data; here we are going to generate a new record set containing the group name (remember from the previous step, this is the "page" field) and the SUM of the values of the "requests" field. To understand where the "filtered_records.requests" expression comes from, you could use the handy DESCRIBE command to visualize the structure of the records generated by the GROUP command:
 grunt> describe records_by_page;
records_by_page: {group: chararray,filtered_records: {(project: chararray,page: chararray,requests: int,size: int)}}
This is how you can see that you need to sum the "requests" field from the "filtered_records" tuple in order to find the total number of requests for a given page.
 result = order sum_pages by $1 desc;
result_limit = limit result 100;
These two lines are fairly self-explanatory: ORDER will sort our records, and LIMIT will only keep the first 100, because we certainly do not want to deal with the incredibly long tail of Wikipedia pages that are only accessed once per day!
store result_limit into 'wp_april_1st';
And our final statement will tell Pig to store the results in the "wpapril1st" file. This is the statement that will actually tell Pig to work its magic and start running the MapReduce jobs. As you can guess, depending on the amount of data that you LOADed in the first statement, the computation can take quite a while.
That's all, folks!
The output in Grunt is fairly verbose, and while the jobs are running you can check their progress using the Hadoop Status Page link on the Desktop (Grunt also gives you some URLs pointing directly to the jobs status pages). Pig will generate and chain several MapReduce jobs as required.

At the end, Pig will give you some interesting stats about the run, including the total time taken to process the data, the amount of data read, the MapReduce jobs generated, etc. For example, in my test, it took about 6 minutes to process 160 million lines of logs:
- Started At: 2013-04-16 07:26:39
- Finished At: 2013-04-16 07:33:58
- Input(s): Successfully read 163288474 records (8954 bytes) from: "/user/admin/wp0401/pagecounts-20130401-*.gz"
- Output(s): Successfully stored 100 records in: "asv://myhdi@tomhdi.blob.core.windows.net/user/admin/wpapril1st"
And of course, the result! The easiest way to read the results in our case (because there are only 100 records) is to just cat the file from Grunt:
cat wp_april_1st
But you could also use copyToLocal to copy the file to your local disk and read it using Notepad. Without further ado, the results:
 Main_Page                       8695731
Special:Search                  2735038
Special:Random                  1844895
April_Fools%27_Day              502216
Diaper                          405342
Dumpster                        379215
Durian                          352748
Airport_terminal                345508
Waffle                          295425
The_Walking_Dead_(TV_series)    265686
undefined                       259862
Game_of_Thrones                 235499
Ground_Zero_(1987_film)         232729
No surprise, the main page comes first, followed by two "special" pages. "April Fool's Day" is the most viewed page after that. I think the next three results, "Diaper", "Dumpster" and "Durian", plus "Waffle" after that may have something to do with Google's Google Nose joke :-)
Hope you enjoyed this little tutorial!