What’s new with T4 in Visual Studio 2012 Release Candidate
I’m a bit quicker off the mark than I was with our Beta as this is my first day back from vacation after our Release Candidate has launched. We have one final significant T4 feature to add for Visual Studio 2012 in addition to all of the stuff from out beta and developer previews, and it’s a doozy!
- T4 template debugging
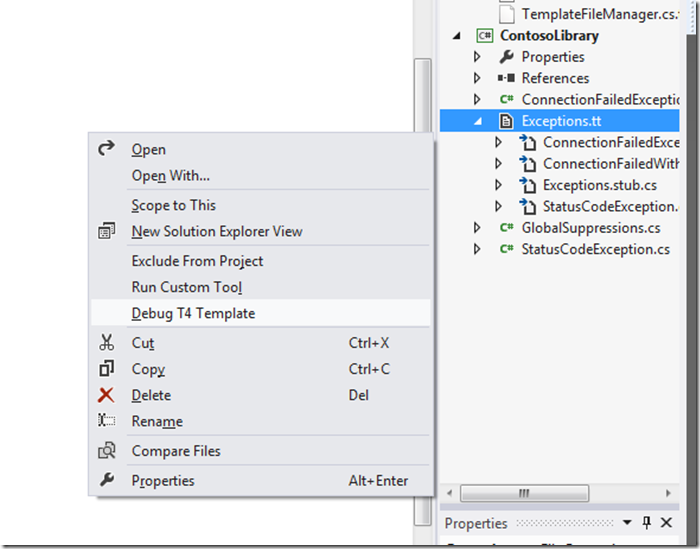
In past releases of Visual Studio, debugging T4 templates has been a little more work than we’d like, so we’ve addressed that in this release with a simple to use but full-featured debugging experience:
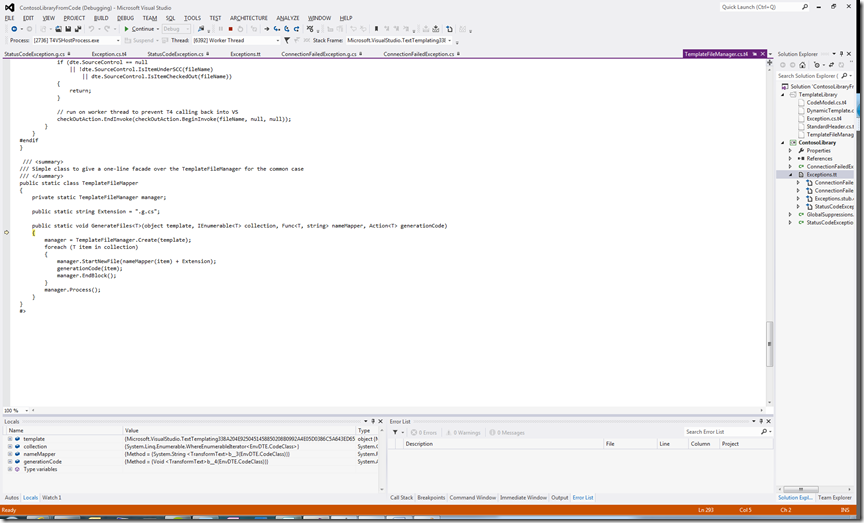
You’ll see the ‘Debug T4 Template’ menu item above on the context menu for the template in the Solution Explorer. There’s no need to set the debug flag on the template directive or any other special magic; just set a breakpoint in your T4 template and launch the debugger. You’ll have full access to step through your template code and look at variables in the locals window.
There’s also new service interface, IDebugTextTemplating, to allow folks who use T4’s Visual Studio API to call T4 asynchronously under the debugger and so build equivalent debugging facilities into their tools, plus a couple of new support pieces under the hood to enable all this whilst maintaining backward compatibility on our existing interfaces.
I hope you enjoy the new productivity of debugging your T4 templates in our release candidate!
Technorati Tags: T4,Visual Studio 2012,Release Candidate,Debugging

