How To: Use Xperf
This is Syed Aslam Basha here from Relationship experience division (RXD) team.
You can use Xperf tool to capture trace and narrow down exact processes/operation which is causing performance issue like CPU usage, disk utilization by process, File I/O Types, processes usage and etc.
Example: To trace disk IO and CPU usage run the following trace command
E:\xperf>Xperf.exe -START -on FileIO+CSWITCH+DISK_IO_INIT+PROFILE+FILENAME+DRIVERS+NETWORKTRACE+DPC+INTERRUPT+Latency -stackwalk CSwitch+DiskReadInit+DiskWriteInit+DiskFlushInit+FileCreate+FileCleanup+FileClose+FileRead+FileWrite+FileFlush+profile -f E:\xperfresults\GSdiskio.etl -BufferSize 1024 -MaxBuffers 1024 -MaxFile 1024 -FileMode Circular
Run the performance scripts.
Stop tracing.
E:\xperf>xperf -stop
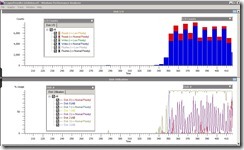
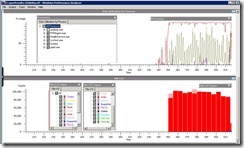
GSdiskio.etl is the trace file name open the trace file using xperfview.exe and analyze the results.
For more information refer the https://msdn.microsoft.com/en-us/performance/cc709422
https://msdn.microsoft.com/en-us/performance/cc825801.aspx
- Syed Aslam Basha ( syedab@microsoft.com )
Relationship experience division (RXD) Team
Test Lead
Please leave a comment if the blog post has helped you.

