Silverlight Early Adopter Award-Winner comparis.ch goes live with “Preisentwicklung für Immobilien” solution
At Shape 2008 in late November, comparis.ch won one of the Sillverlight Early Adopter Award with their “Preisentwicklung für Immobilien”. This week, the solution went live.
comparis.ch has been storing in their systems tons of real estate information during the years. Aim of the “Preisentwicklung für Immobilien” site is to inform the user about the historical price evolution of a given object extrapolated from the rent / buy ads collected.
comparis.ch decided a while ago to represent this information on a map. Despite the successful launch a while ago of their first, AJAX-based implementation, their experience with that technology hasn’t been too positive. Long development time, difficult debugging, cumbersome handling of information layouting, and important performance issues related to representation of push-pins, moved them to try out Silverlight for an alternative implementation. In less than 2 weeks, they were able to prototype the solution that was presented at Shape 2008, which represented for them a huge productivity improvement and a much smoother interface for the users.
Because of other end of the year priority, the project was set for a few weeks on a side to be then restarted, finalized, and put into production this week.
You can find the solution under: https://www.comparis.ch/immobilien/marktplatz/map/immomap_v1.aspx.
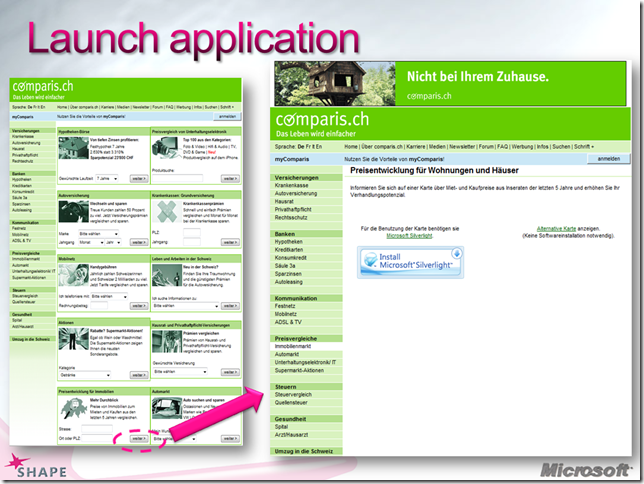
When the user goes on www.comparis.ch, if she doesn’t have Silverlight installed, she will be first prompted to install the Silverlight Browser plug-in (or to use the previous ajax-based solution).
After the non-invasive installation of the per-default self-updating Silverlight plug-in (4MB, no reboot necessary), the user is shown a user-friendly, elegant search interface. After having inserted the search criteria, the application zooms to the right spot and shows instantaneously the available real estate information in forms of gray (historical-only) or green (currently available) dots (objects). “Mouse over” the dot displays the address of the object, clicking on the dot a pop-up displays the price evolution.
If the user drags the map, new dots appear rapidly on the screen. Smooth & clean.
Congratulations to Benedikt Unold and his team for this great achievement.


