Reporting in Team Foundation Server – Part 7: Excel Reports from Work Item Queries
In my last post in this series, I covered the new SQL RS reports we have in TFS 2010. Let’s look at a cool new feature for generating a report in Microsoft Excel based on a work item query.
- Walkthroughs for out-of-the-box experience including customizations
- SharePoint Dashboard
- Rich SQL Reporting Services Reports
- Excel Reports from Work Item Queries
- Custom report authoring tools and walkthroughs
- An overview of the reporting architecture
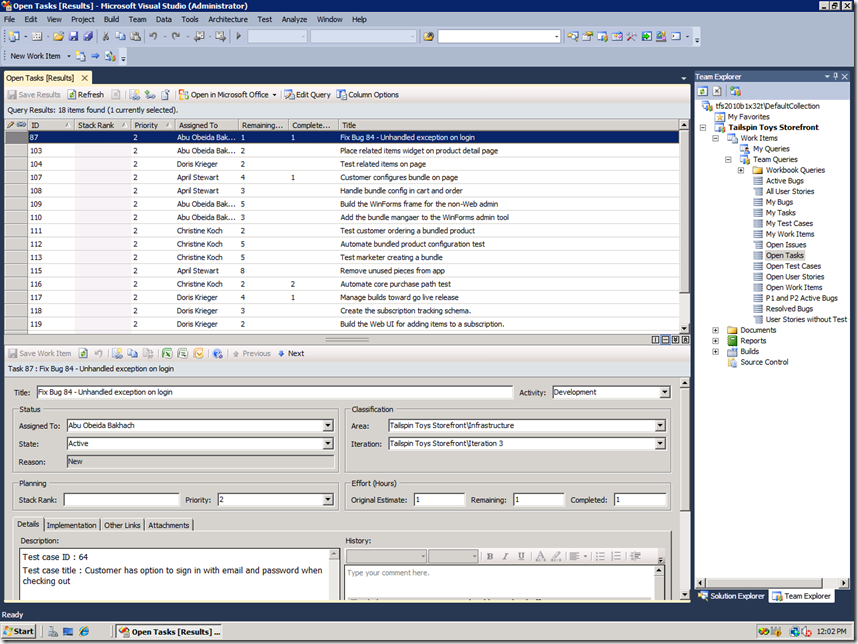
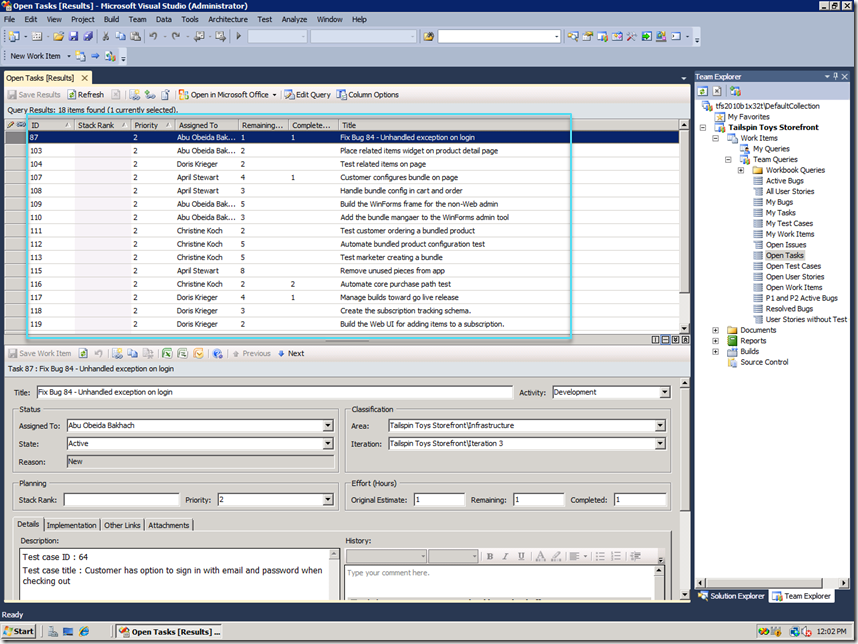
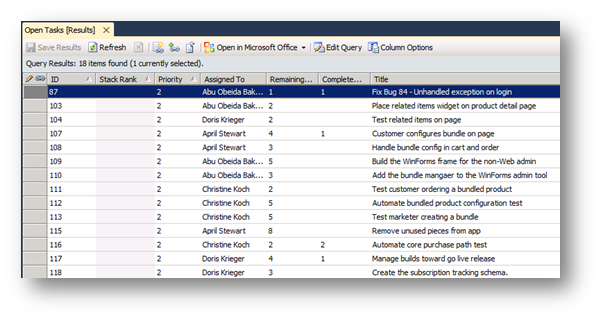
I know how to get this list of results using a work item query:
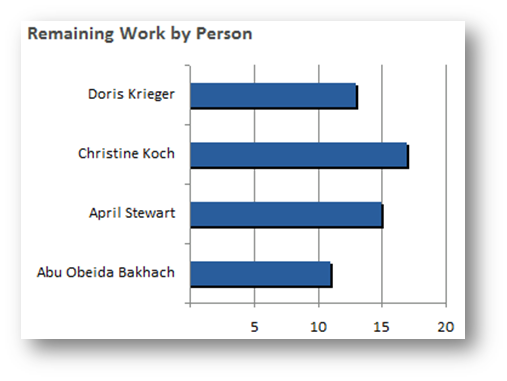
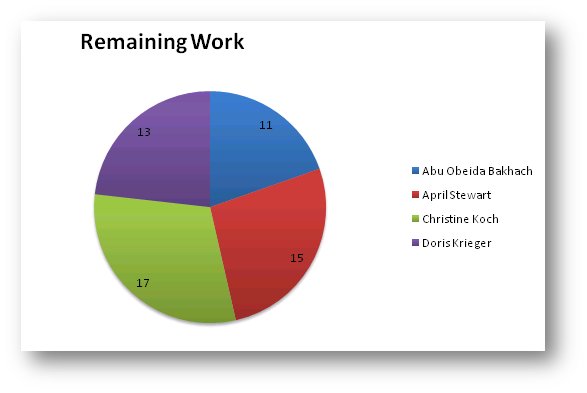
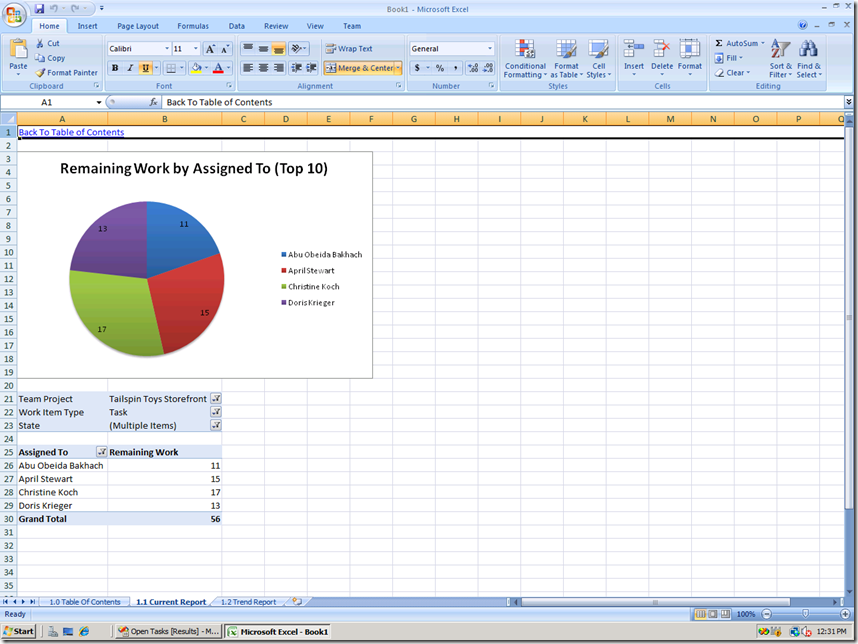
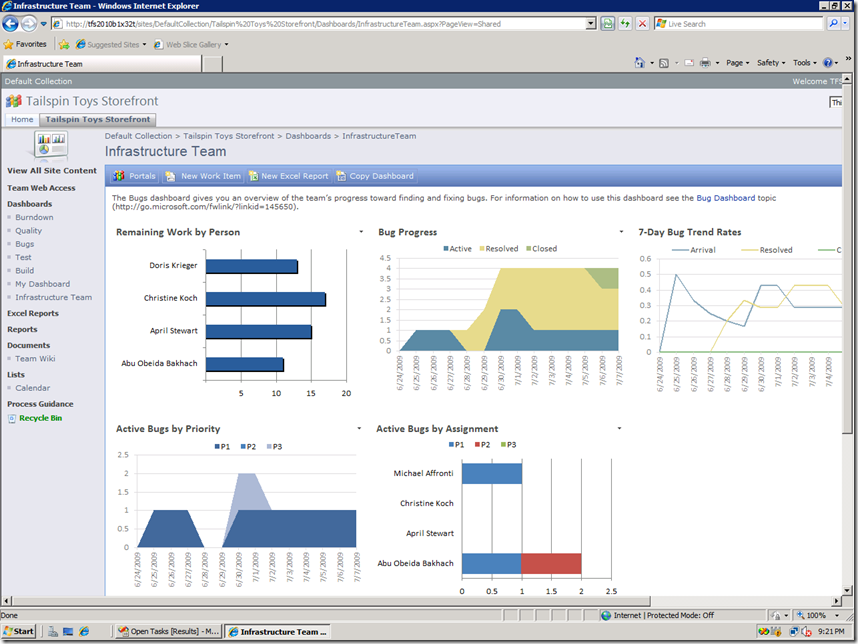
But, I want a chart like these without having to ask my developers:
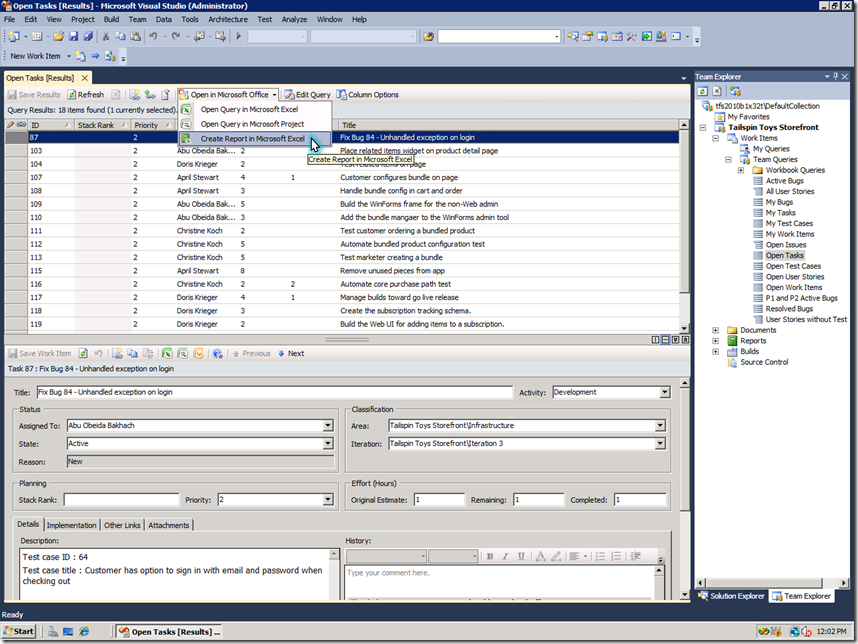
Let’s look at how to get this done in TFS 2010:
Perfect – a cool report generated with just a few mouse clicks! Now, let’s backup and see how this works.
First, I ran a query to get Active Tasks in my project showing Assigned To, Remaining Work, Completed Work etc. in my query results:
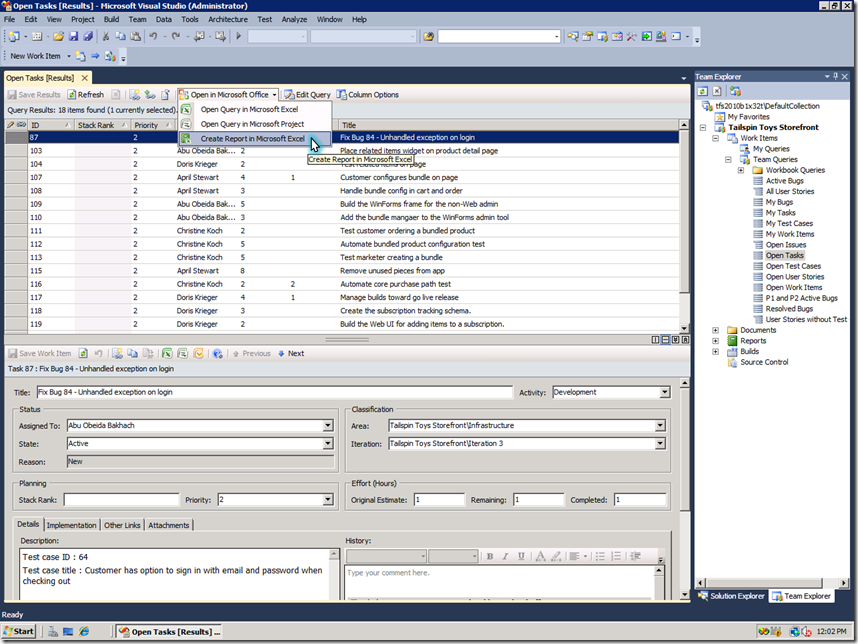
In the new menu bar that’s on the query results window, I have a new option to create a report in Excel:
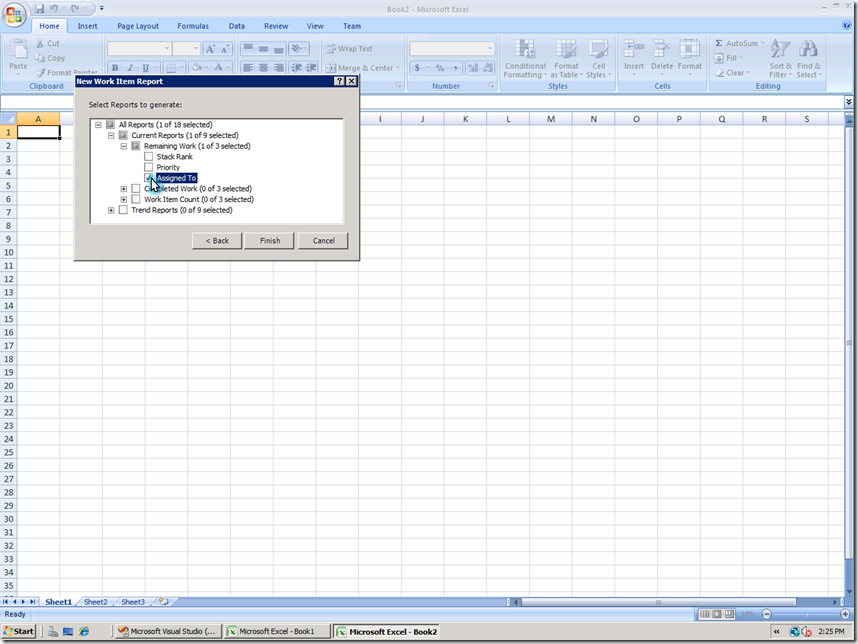
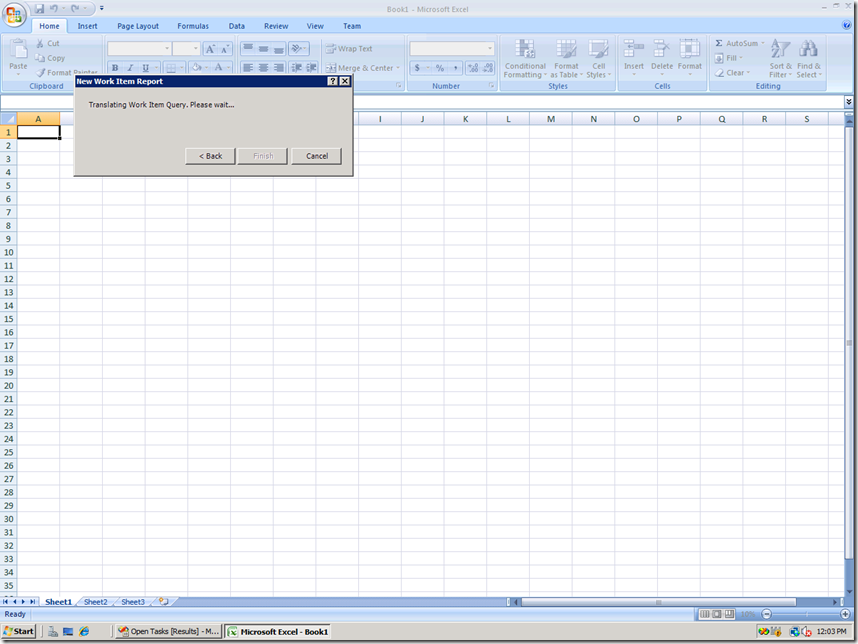
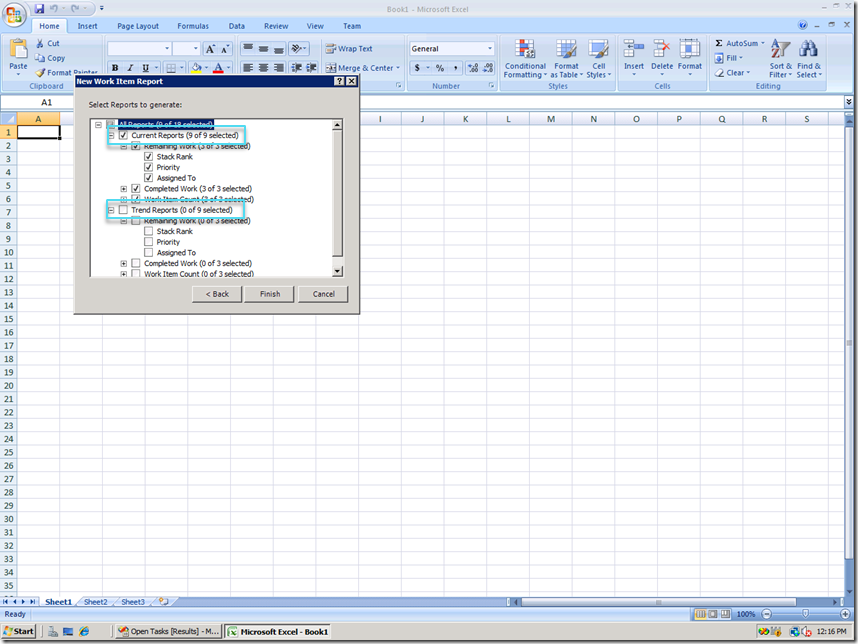
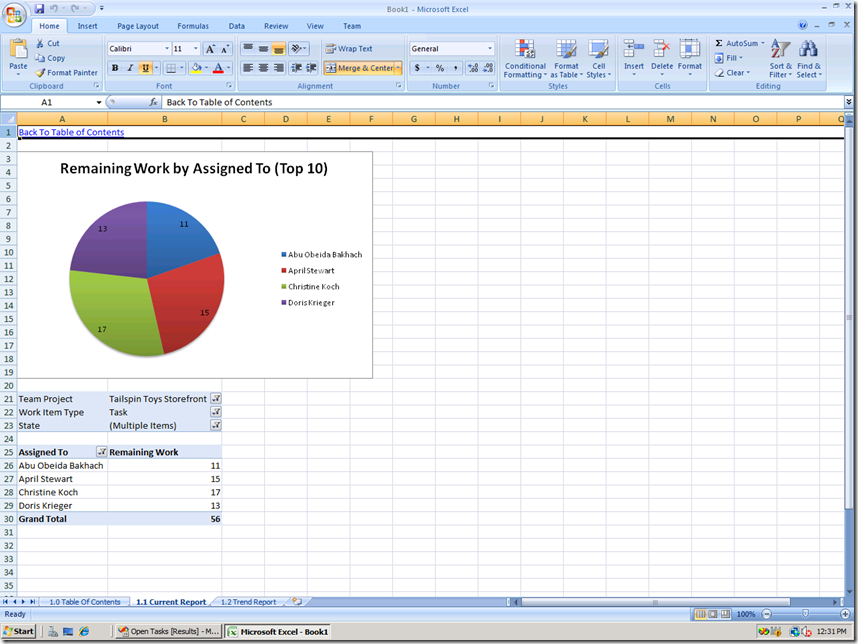
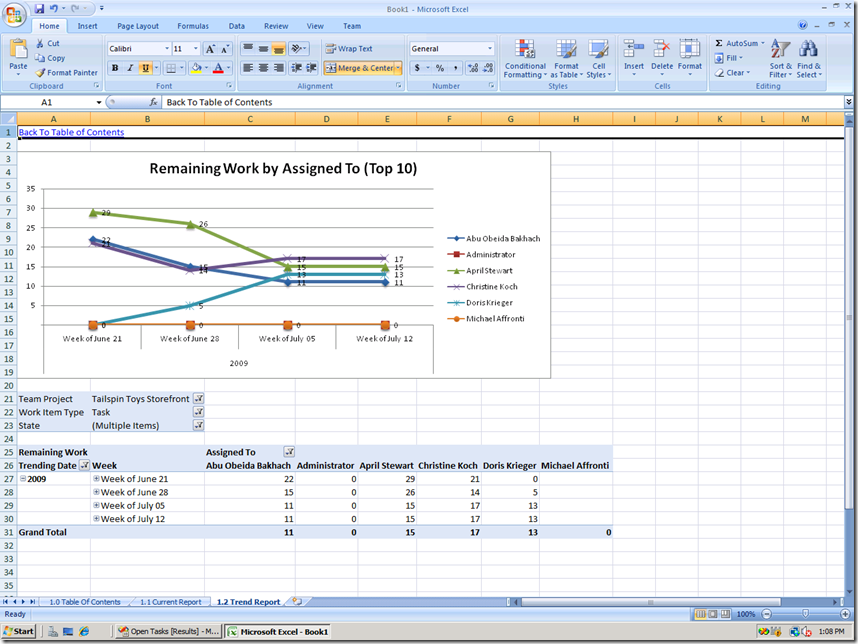
The work item query is translated to figure out the reports that can be generated and I get report options based on columns included in my work item query. I have the option to generate Current as well as Trend reports.
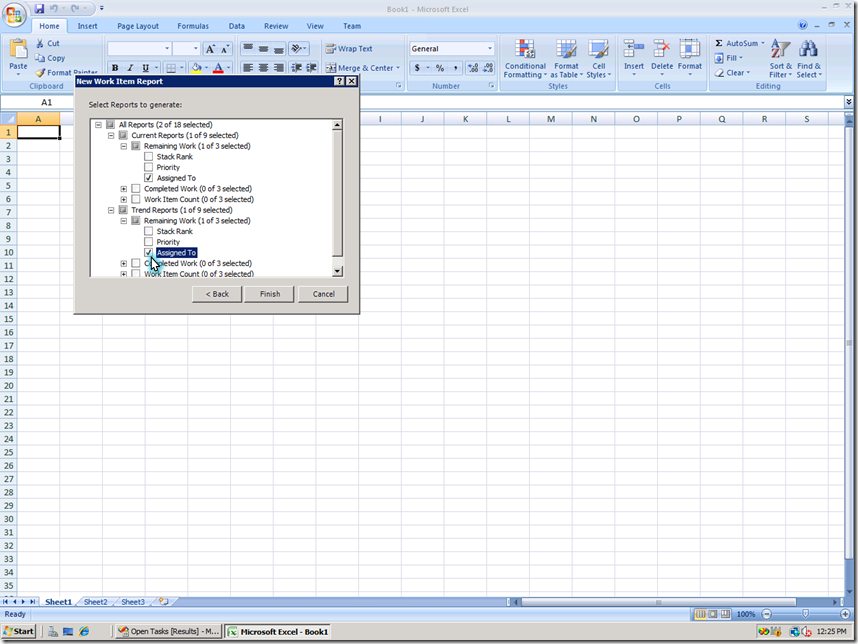
Let’s pick current and trend reports for remaining work by assignment:
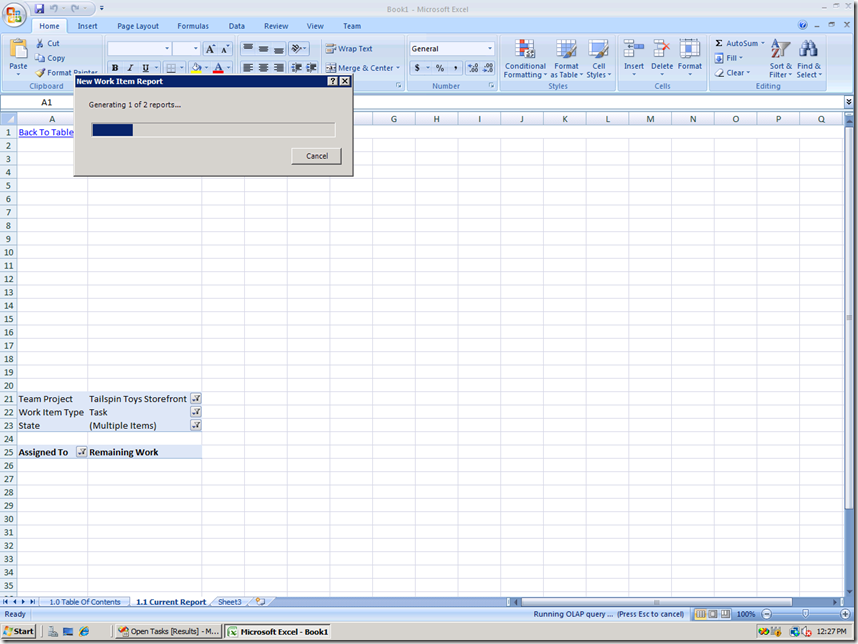
The selected reports are generated:
Current report:
and Trend report:
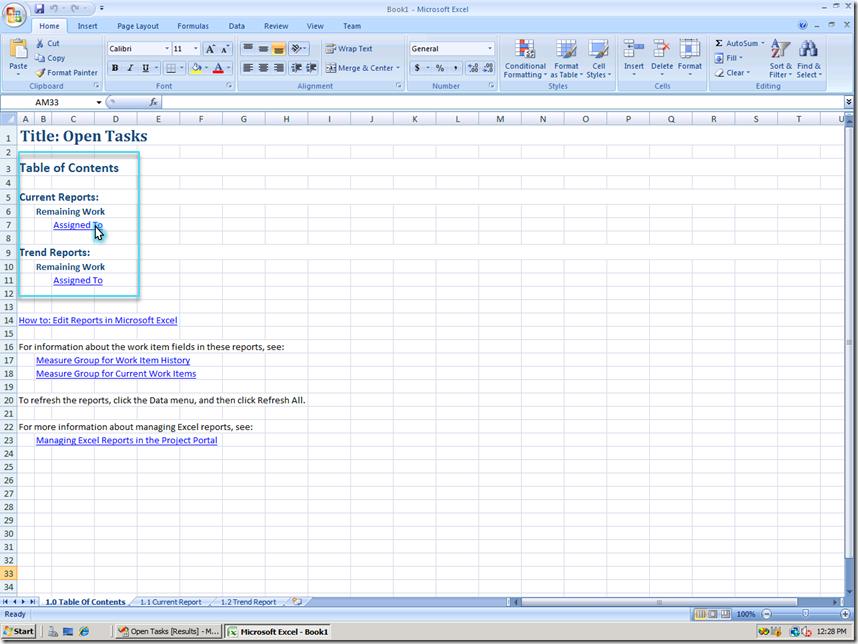
Now, that was super easy! The first worksheet generated includes a useful table of contents with links to reports:
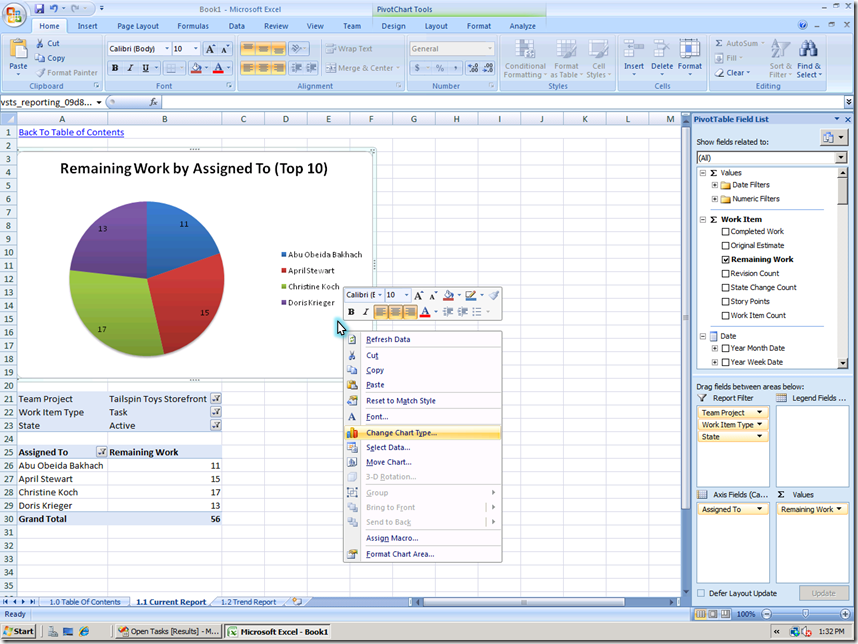
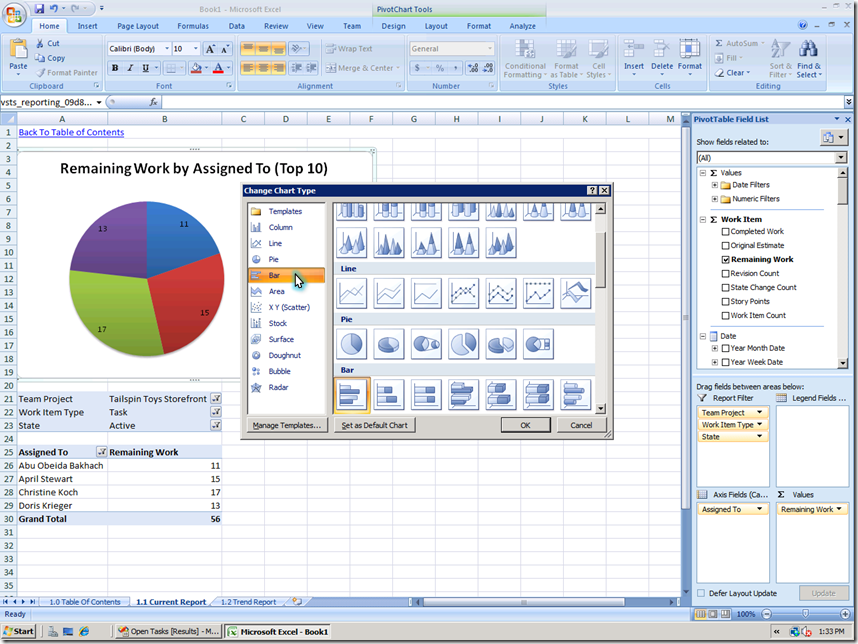
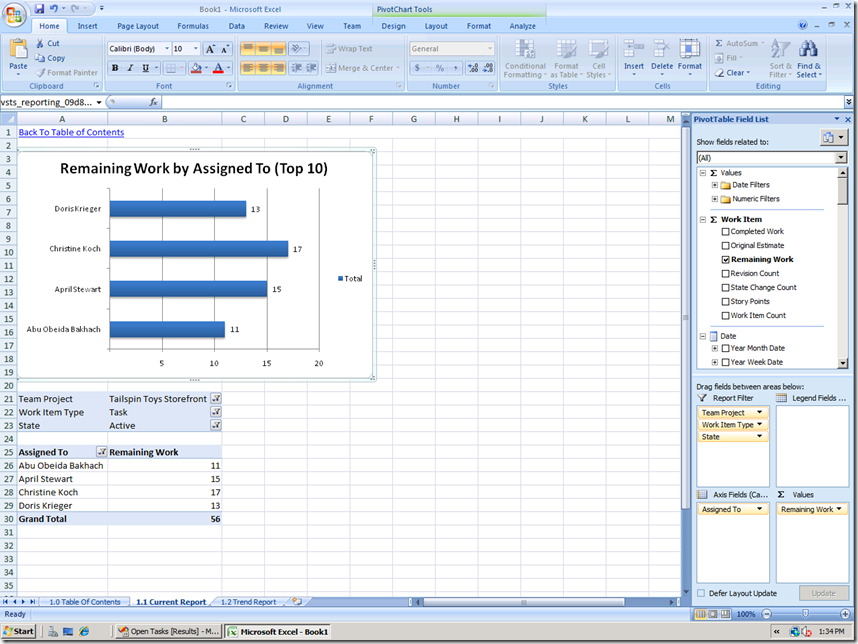
The reports that are generated are not static and can be modified so it is very powerful. Let’s say I want to make some simple adjustments to the current report so it’s a bar chart and also tweak some colors. I can just as easily tweak the Team Project filter to make it a cross project report or drag additional fields like Completed Work to show more information.
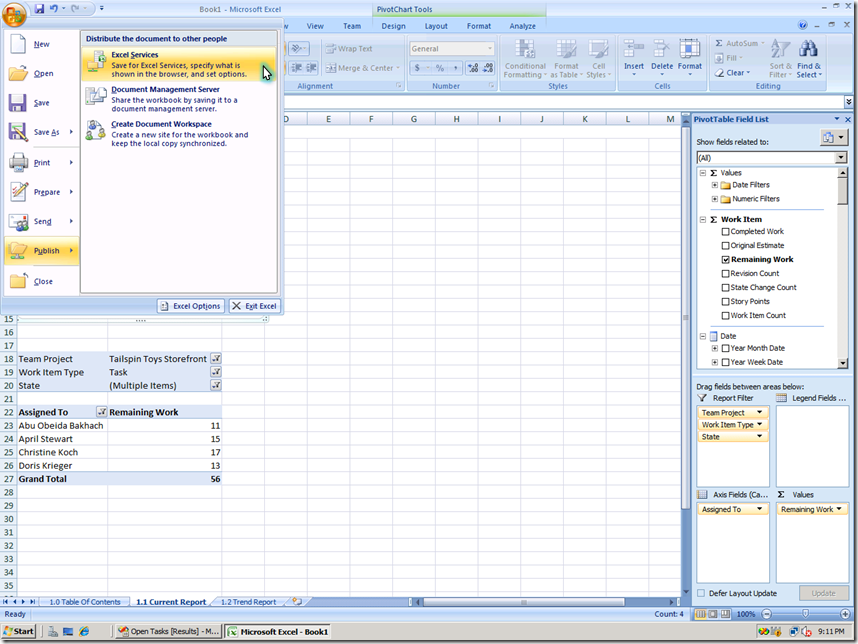
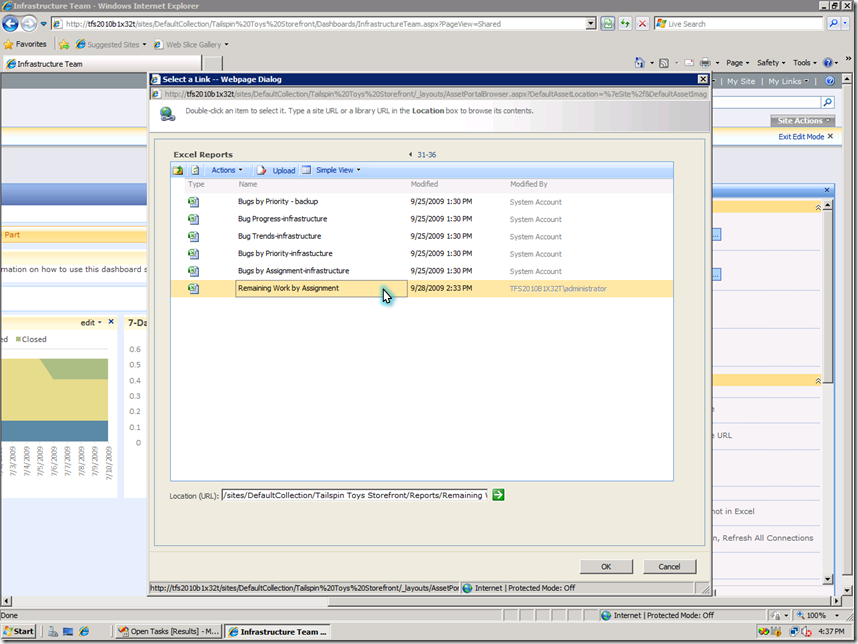
Similar to what we saw in my previous posts, I can easily publish this report to my team dashboard to share this with my team. I can use the Excel Services Options button to publish the entire workbook or specific charts. I’ll publish the customized report to the Excel Reports document library like the out-of-the-box Excel reports shown on the MOSS dashboard.
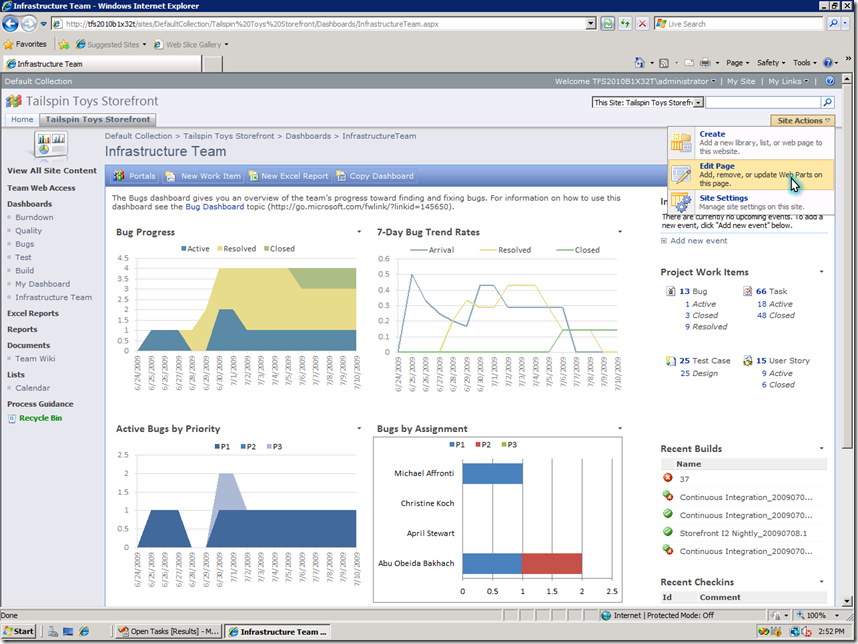
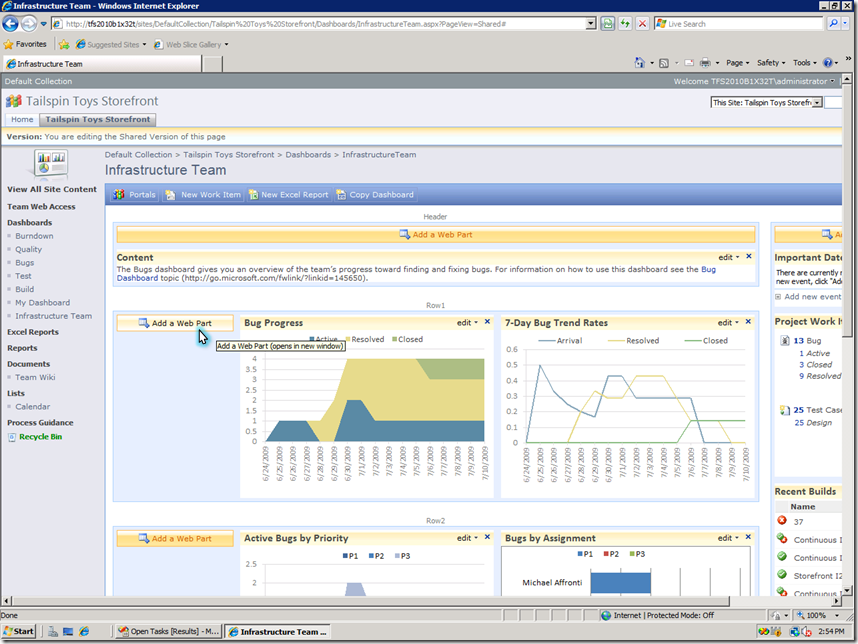
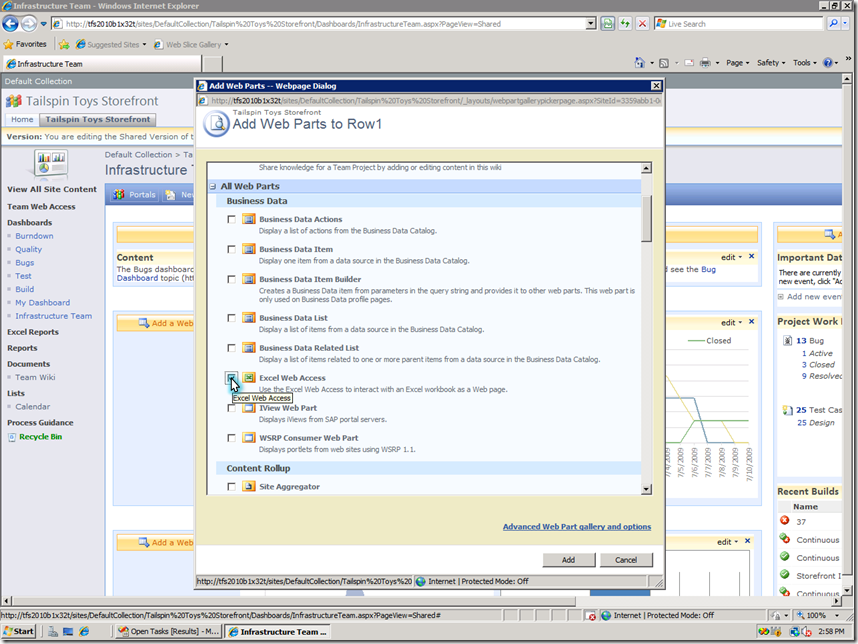
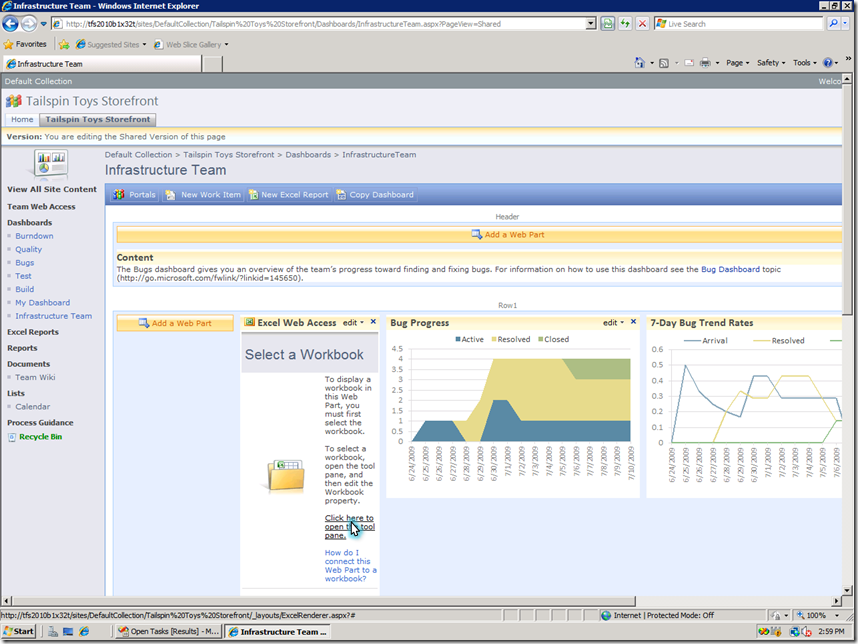
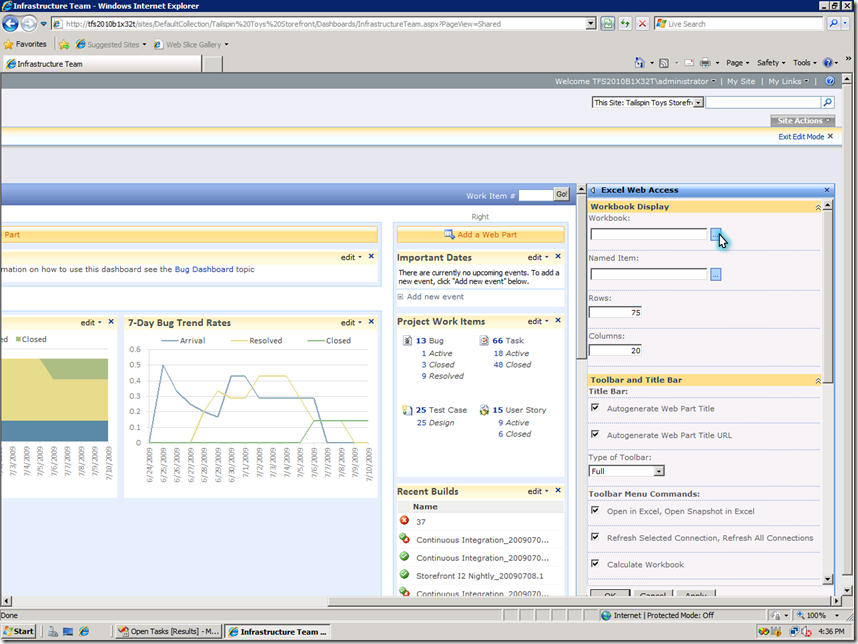
Then, I all have to do is use standard SharePoint functionality to edit my team dashboard, add an Excel Web Access web part to display the report from my newly published workbook:
So, it was easy to go from here…
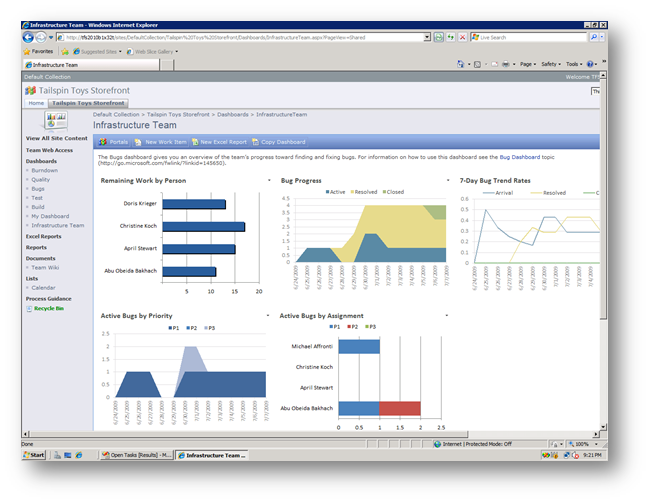
to here:
In the next topic I’ll cover custom reporting including walkthroughs for tools of choice. If you have questions or feedback please leave me a comment or send me an email at sunder.raman at microsoft.com

