Reporting in Team Foundation Server 2010 – Part 2: SharePoint Dashboards: SharePoint Server dashboard
In my last post, I outlined the out-of-the-box reporting options available in 2010:
- SharePoint Dashboards
- Rich SQL Reporting Services (SSRS) Reports
- Excel Reports from Work Item Queries
Let’s walkthrough the dashboard experience when you integrate TFS with SharePoint. I’ll break this topic down a bit further to cover in detail:
- SharePoint Dashboards
- SharePoint Server dashboard
- Out-of-the-box experience
- Customizing the dashboard
- Creating a team dashboard
- Windows SharePoint Services/SharePoint Foundation dashboard
- SharePoint Server dashboard
SharePoint Server dashboard: Out-of-the-box experience
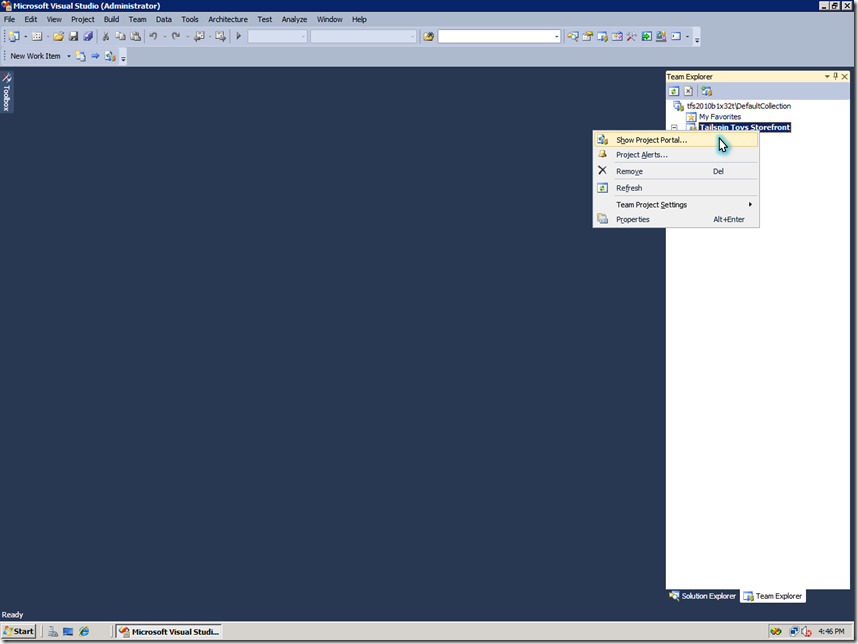
I can right-click on my project in Team Explorer and open the project portal to navigate to my dashboard.
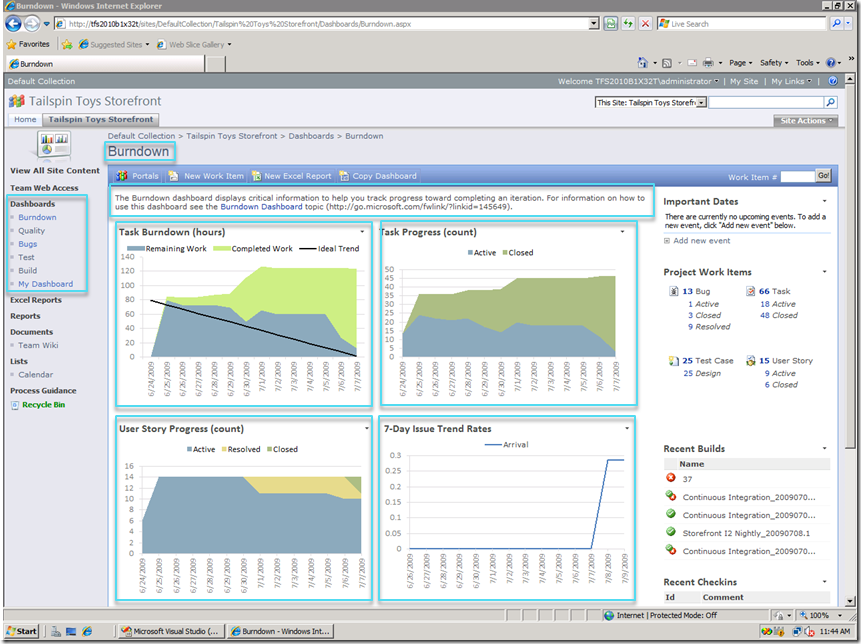
The portal loads and shows the Burndown dashboard:
- The left navigation pane includes links to additional dashboards, for example Quality, Bugs, Test etc.
- Each dashboard includes a description outlining the information displayed
- Reports are shown side-by-side in context with other relevant metrics
- Burn dashboard includes reports to answer the following questions, and yes, we do have a burndown:
- Are we making progress on tasks?
- Are we making progress on user stories?
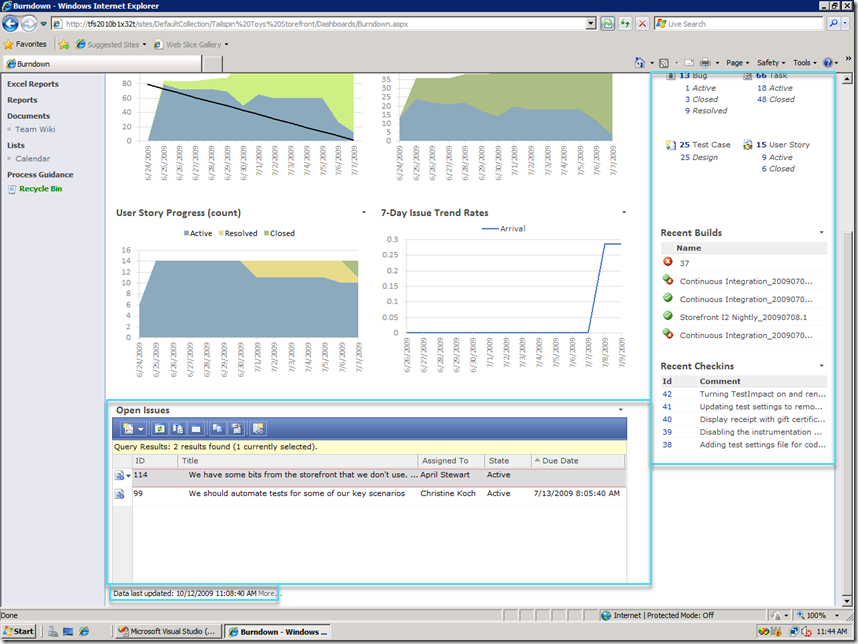
- How are we doing on open issues?
In addition to the reports, the dashboards also include interactive Team Web Access web parts that show live data in TFS. On this dashboard is an overview of the work items in this project (number of bugs, tasks etc.), recent build and checkin information on the right hand side. And the detailed list of open issues is included in its own web part.
The difference between the trend reports and the web parts to note here is that the data in the reports is pulled from the Analysis Services cube and the web part data is from the live operational store. The data shown in the reports has an inherent latency and the “freshness” of these reports is indicated by the ‘last updated’ timestamp that is included at the bottom of the dashboard page.
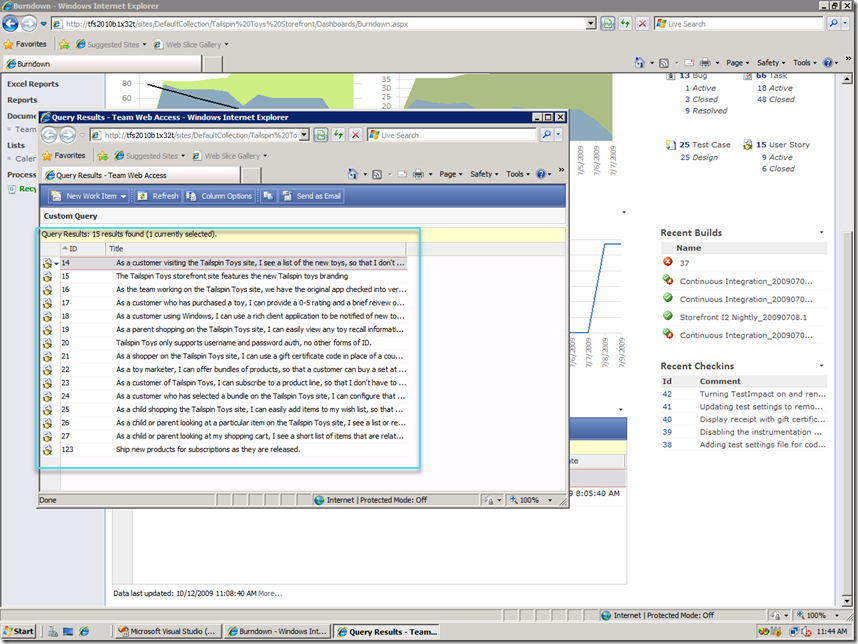
Clicking on ‘15 User Story’ link on the right hand side will pull up the actual work item list in Team Web Access:
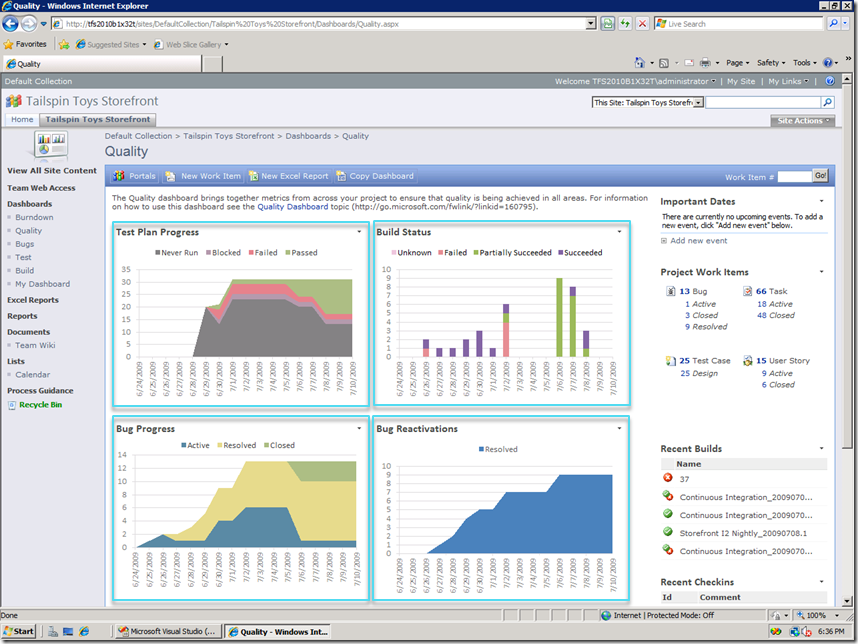
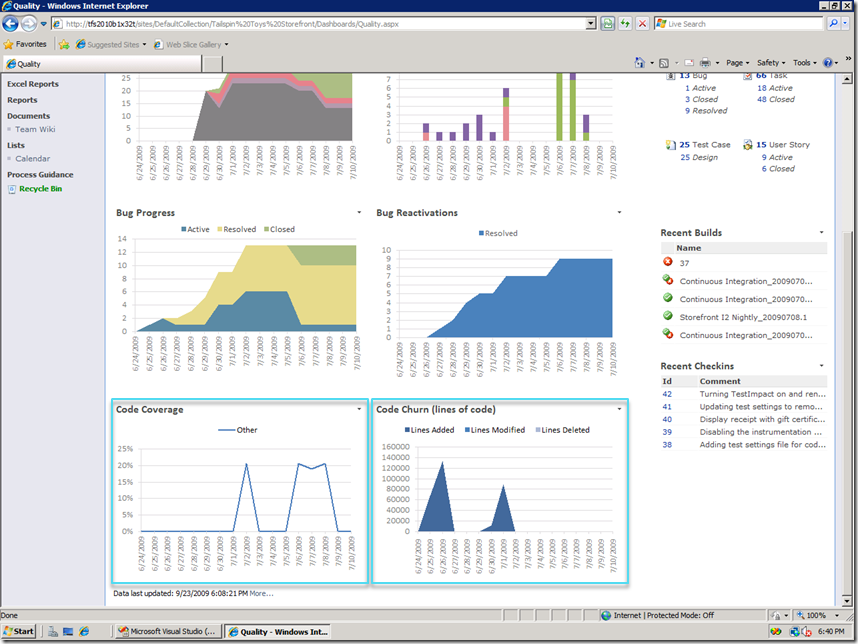
It’s not all about work, so let’s take a look at the Quality dashboard which includes reports that answer the following questions about product quality:
- Are we making progress on running test plans?
- How are our builds doing over time?
- Are we fixing bugs?
- What’s the quality of our bug fixes?
- Are we getting enough code coverage?
- How many lines of code are we churning?
In the next post, I’ll cover SharePoint Server dashboard customization. If you have questions or feedback please leave me a comment or send me an email at sunder.raman at microsoft.com
