Software Updates–INTERNALS! (MMS 2011 session)–part I
Several folks have asked that I transform my MMS 2011 presentation on the internals of software updates into a blog post. Happy to oblige!
The topic at hand is focused on software updating – in my MMS presentation I discussed the WSUS (SUP) sync process, SDM and CI’s, what they are and how they are represented in the database and then focused on the flow of events as software update scanning and deployment takes place on the client. This first entry will focus on that client side flow for update scanning and deployment. Future blog entries will dig into the CI’s and SDM packages and also the update sync process.
As we get started it’s important to note that the flow I will show you is but one path that might be followed during the update process. Depending on the conditions at the client during this process several branches in processing may come into play. As we go through the flow I will point out the areas where additional branching may take place. Further, we are looking at this from the software updates focus. Understanding this flow is more important than just software updates. Many of these same components come into play for any component making use of the CI/SDM package infrastructure – such as NAP, OSD and DCM. DCM is actually the framework software updating is built upon. Also, in ConfigMgr 2012 our dependence on this type of structure becomes even greater.
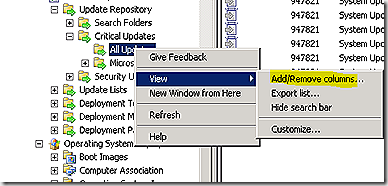
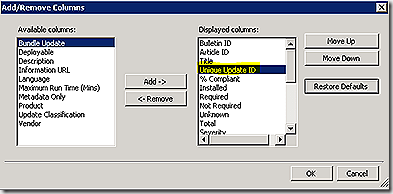
OK, lets get started. A few rules of thumb for any effort toward following the logs for software updates. First, follow the GUID! It’s easy to get lost in the software update logs when trying to track by bulletin ID, KB number of patch name – these values aren’t used consistently in all of the logs. Instead, track the GUID. Unfortunately, the update GUID isn’t a value exposed by default in the ConfigMgr console - but it’s easy enough to add. Just choose an update category in the console, right-click the category and select view > Add/Remove columns and add in the ‘unique update id’ value. This will add the column to the bottom of the displayed list. I like to move it toward the top so it is more easily visible.
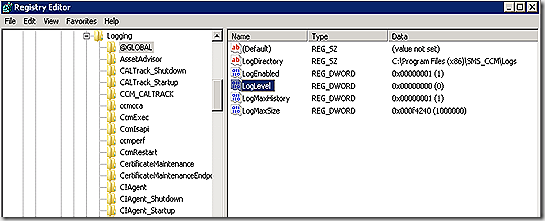
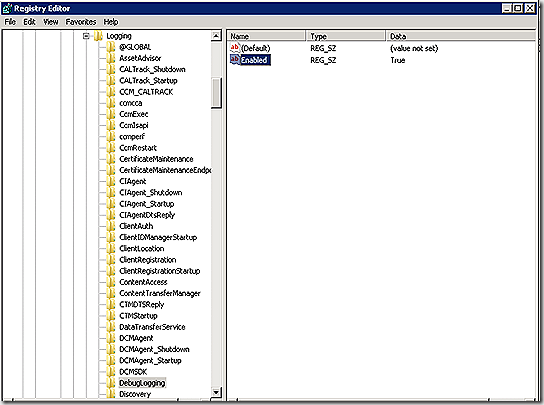
Next, make sure verbose and debug logging are enabled on the client before attempting to track through the logs. Without verbose/debug much of the detail in the logs is obscured. Enabling is a simple matter. In the registry, navigate to HKLM/Software\Wow6432Node\Microsoft\CCM\Logging. Two changes are needed. Under the @Global key, change LogLevel from 1 to 0. Also, under Logging add a new key called DebugLogging and create a string value named Enabled with a value of True – as shown. No service restart should be required for the extra logging to kick in.
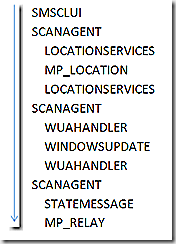
OK, lets first discuss update scanning. Scanning is a more succinct flow and helps ease us into following the logs. Scanning can be initiated manually, on a schedule or as a part of deployment. The example we will look at is a scenario where an administrator is wanting to verify the latest update results are reflected on the client – such as if an update failed and is being manually remediated and, once fixed, an update to scan results are necessary to get the updated patch compliance data reflected on the client and ultimately transmitted to the site. With scanning we have a few major milestones as we move along the process – (1) the scan is requested (2) the scan itself takes place – which ultimately invokes windows update agent and (3) the state from the scan is returned. There are a number of components that get called along the way to make all of this happen. The graphic is an attempt to show that scanagent is the ‘orchestration’ (my term) component – meaning it leads the process but has to pull in other pieces to help out along the way. The graphic also shows the order in which components are called and how data moves back and forth. As an example – scanagent calls locationservices – locationservices does its piece and hands off to MP_Location. MP_Location finishes up and hands it’s results back to locationservices and locationservices completes it’s request and hands everything back to scanagent.
Finally – to the logs to see how this all looks there. I go back and forth on the best way to present a discussion of log flow. For this post I have color coded the logs to make component handoff easier to follow. I have also highlighted all GUIDs to call them out. I’ve also pulled out the timestamp that was in place in the logs. The time stamp is critical in helping us understand the flow of events in the logs. Also note that I have highlighted the specific logs involved in update processing. Other components are involved as well even beyond the entries show here to accommodate things like transferring information to the management point. Also note that the log entries we will review are significantly edited. This is for the purpose of readability and to hone in on the key entries that show how our process is progressing. Lastly, things happen in the logs very quickly – many events inside a single second. This makes ordering the events that happen within that second in multiple logs a bit of a challenge. You always wonder if you have the order just right – you may see some of that in the placement of log snips below. In some cases it may look like a particular entry should have been placed before another. When I look at processes spanning multiple logs like this I pull them all into Trace32 and merge them so that the system orders the entries for me (more on that in a bit). That is how I came up with the order for the log entries below.
In this example, I have initiated scanning manually. SMSCLIUI records this and sends a message to begin the scan.
ScanAgent receives the message and begins the scan process. Here we see that the update source is identified by GUID and at the end of this snip the GUID is interpreted to be the WSUS Server. Its also possible other scan tools may show here – I’ve seen ITMU in the list before. Before we can proceed with the scan we must find out where our WSUS server is that we should use – on the last line we see the request for the WSUS Server Location.

LocationServices picks up and the location request is created and sent to find the content in question. Note – locationservices on the client doesn’t know anything about content locations – all it does is send request to the component that does know – the management point. That’s what is being done here. From here the location request goes forward

The request is transferred to the management point and received by MP_LocationManager (MP_Location for short). Here we see the request details being pulled in and then processed against the database to result in a list of available WSUS servers that will be returned to the client. Note that this request is processed by the management point but the results actually come from a stored procedure that is run against the database – the stored procedure is called out in the log – it is MP_GetWSUSServerLocations. There are parameters passed into this stored procedure – the parameters listed just above. If you want to see the procedure and parameters passed you can capture that with a SQL Profiler session running alongside during the time of the request – or just crack open the stored procedure to see what parameters are needed and supply those if you want to run the procedure manually.

Continuing to follow our timeline, we see ScanAgent come alive again – this time simply recording ongoing processing. Here we see that the scan request is queued and ready to go – all we need are the results from our location request.

LocationServices now gets the results of the location request back from the MP and records that info.

ScanAgent records receipt of location request data and initiates the scan.

The component that will handle the scan is WUAHandler. The scan is now initiated

ScanAgent reporting that scan has been successfully requested for our WSUS tool

WUAHandler continues processing the scan – note that the scan takes 6 seconds. Again, WUAHandler isn’t actually doing the scan. The WindowsUpdate agent is invoked here. You can definitely see the scan results proceeding in both the WUAHandler log and the WindowsUpdate agent log – to me the more user friendly log is the WUAHandler version.

ScanAgent reports that the scan is complete and now we need to record the results of the scan in the updatesstore.

The updatesstore goes through each update and writes it’s status into WMI (in the updatesstore namespace). Note that in this case the status of my update hasn’t changed so we record processing the scan results but don’t change anything and don’t raise a state message.

ScanAgent records the scan is now done and that now we need to send any related state messages that have surfaced/been created during the scan. In my case there are no state messages that have been generated so will bypass the logs for that – but for full discussion the two components involved in recording, sending and processing state messages forward to the site server are the statemessage system (statemessage.log) and MP_Relay – the component on the management point that receives and forwards to the site server.

And that’s it – for the scan anyway. Not too difficult or complicated. Now for the deployment. ![]()
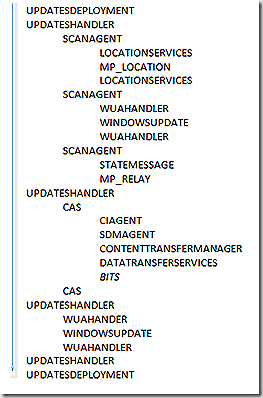
With deployment we also have major milestones during the process – (1) evaluate deployment job, (2) Scan for update applicability and report status, (3) Retrieve needed update components – CI/SDM/update files, (4) Apply the update, (5) Rescan for update status and (6) Report state. There are a number of components that get called here – and remember that depending on the current state of a client will determine which of the branches of processing will fully be executed. Our look at update deployment will pick up on the client side after it has received policy and knows there is an update to deploy.
For our example I simply initiated the deployment manually. The first update related component to become active is updatesdeployment. Updatesdeployment is the top level ‘orchestration’ processes in the flow. There are a few others we will get to as we go along but as we continue you will see updatedeployment continues to enter the picture as it receives status and job tracking updates from other components. Here in updatedeployment you can see that I initiated this deployment install.

The first component that wakes up to start assembling the various pieces is CIAgent. The first GUID is simply the GUID of the CIAgent job that was created. The second GUID (which starts with SUM_) represents the unique update id of the update being deployed. This is the update the client is requesting.

We see our orchestration process record that we are now in the state of ciStateSubmitted and the download options that are available. We also see the CIAgent job being called out here – note that the CIAgentJob GUID from the above log entry matches what is being shown in the UpdatesDeployment log. The bottom line of this log snip also indicates that as a part of the CIAgent job we are starting the download of the SDM package – which is the next log snip.

Not only do we need to make sure the CI is present but also the SDM package – SDMAgent spins up a job to retrieve that piece. The package loader job GUID is different but we see the update itself remains trackable by continuing to focus on the unique update GUID.

SDMAgent finishes up and also CIAgent finishes up.

SDMAgent is back and begins the process of applying the update. This is noted in the last two lines of the log where we see that we are starting to Apply and the state of the job transitions to running. Note the job GUID.
Now that we have the green light to proceed with applying the update another ‘orchestration’ process is spawned – UpdatesHandler. UpdatesHandler reviews the job, realizes there is a bundle update that also needs to be applied and adds that to the mix. Now we have two updates to track – our first one (eb02..) and the one we have added at this stage (b09f..). The job GUID here is the same as was called out in the SDMAgent log previously. We now have enough in place to move forward on our job so start the scanning process to see if anything has changed in the environment.
The SDMAgent also moves into a status of StateDetecting

And UpdatesHandler reports back that it has forced a scan.

We have already seen that the component that orchestrates the scan is ScanAgent – but notice in this entry from ScanAgent that it is using cached results. Since the scan results are still valid (their TTL hasn’t expired) then we can save the work or re-running the full scan and simply trust the data we have. Note also that there is a way to force fresh scan results – which can come in handy in some troubleshooting scenarios. More on that later.

UpdatesHandler reports that it has initiated the scan.
SDMAgent records progress.

Back to our top level orchestration process – UpdatesDeployment – reporting that we are in the state ciStateDetecting

Since our cached results are still valid we simply query them from the updatestore

UpdatesHandler reports the scan is done and that the updates download is kicking in. Wait, don’t we have all the components yet you ask? We have 2 of the 3 – we still need the update package itself.

In the SDMAgent log we see that it is still in the downloading state.

The updateshandler log reflects that we are wating for contents of the update to come down and that the download of that content is beginning as part of the install process.

CAS works to retrieve update content – the first thing that happens is that we look locally to see if it is in the cache. In this case it is and we report that and move on. If the content were not in the cache we would go through the process of making a location request and then moving the content down through the datatransferservice and contenttransfermanager components.

UpdatesHandler reports that we have our content and are ready to execute and then requests we run the job now.

CIAgent is reporting that the CI is present and good to go.

UpdatesDeployment receives notification that we are waiting for the install to complete.

SDMAgent also shows we are waiting for the install.

So, just to make sure, we rerun the scan again.

Same as before, we are using cached contents so we move on.

All scanning, verification and evaluation work is now complete and we are ready to install.

CAS comes back in the picture to return the actual location of the content being requested. We have already seen that it is in the cache but now we know exactly where n the cache.

At this point there is a good amount of cross-talk (status updates) between these same threads as the update is installed. WUAHandler marshalls the install process on the SCCM client side but the actual work is done by WindowsUpdate Agent. At the end of this snip the install process has just started.

SDMAgent reflects the state change to installing

UpdatesHandler reflects the state change to installing.

WUAHandler records the progress of the install. Note that this is significantly truncated for brevity – WUAHandler will have multiple entries reflecting the install progress for an update. Finally, the installation is done.

UpdatesHandler reflects that the update install is done and we are now waiting for a reboot.

Now that we have the update installed CAS marks the content as eligible to be removed from the cache. Note that this does not mean that the content will be removed – simply that it is OK to delete it if space is needed for additional content coming down. If you have content that you want to ensure remains in the cache you can override this behavior by using the ‘persist’ flag.

WUAHandler reflects the install is complete.

SDMAgent reflects the install is complete and we are waiting for a reboot.

Finally, updateshandler reflects the update is complete and we are waiting for a reboot.

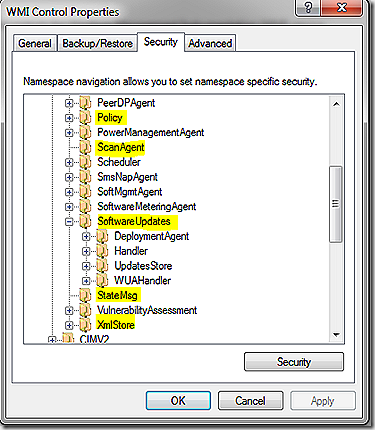
OK, all done – and hopefully our flow of events for update deployment makes more sense now. But, there is more to know besides just the logs. WMI plays a key role for information storage and retrieval. There are lots of WMI namespaces that get touched as part of the software update process. To get a look at all of the WMI namespaces on the client you can assess WMI Control > Properties > Security tab through computer management. The graphic shows many of the namespaces involved in software updates – we will walk through a few of them.
Earlier I mentioned there is a way to easily force the client to produce new scan results rather than using cached. Normally this isn’t needed but in some troubleshooting scenarios it can be helpful. The scan history is kept in root\ccm\scanagent namespace in the scantoolhistory class. The following shots show the class as well as the detail that is kept regarding scan history. If you want to force fresh scan results simply delete the entry here and re-scan.
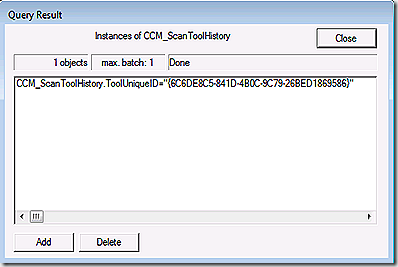
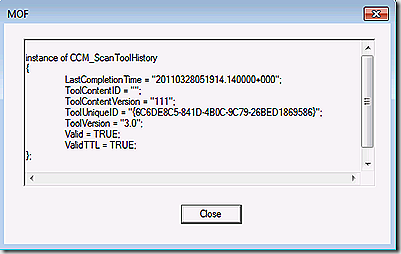
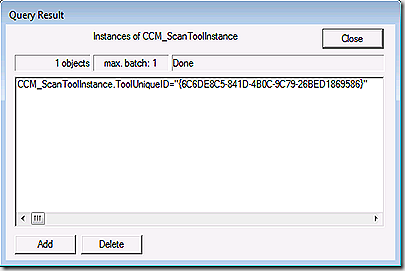
If you want to see all of the scan tools that are in use on the client take a look at the scantoolinstance class in the same namespace. Typically you will only have one entry here that maps to the WSUS server.
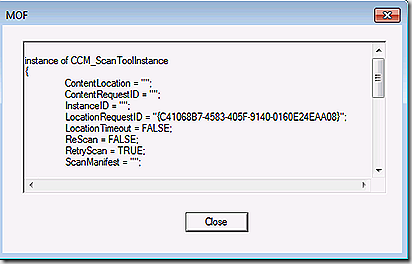
Update deployment first starts in the policy namespace. Connecting to root\ccm\policy\machine\actualconfig we see the CCM_UpdateCIAssignment class. This class holds the assignment ID for update deployments targeted at the client. Each update deployment defined in the console will have a unique GUID listed here with details about the associated updates.
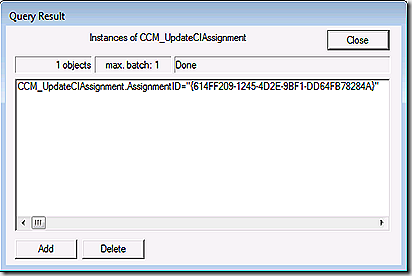
The assignedCI’s line will list the unique update ID’s of all updates that are part of this assignment (deployment). In this case we just have the one. Note that for my test I didn’t make my updates mandatory.
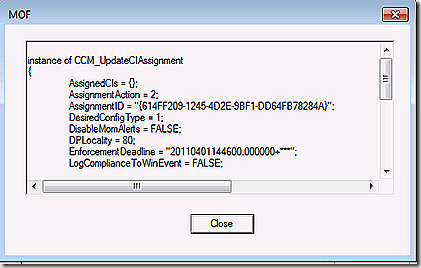
Often it’s easier to read the information here by pasting out to notepad.
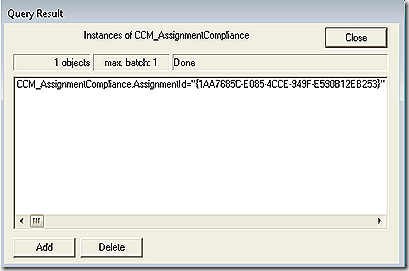
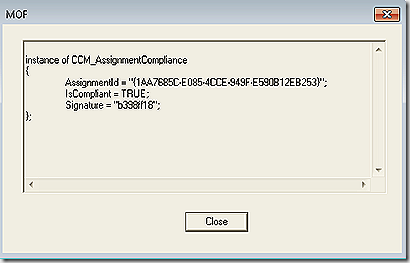
Next, we look in root\ccm\softwareupdates\deploymentagent. There are several classes here. First one to look at is CCM_AssignmentCompliance. This will list the assignment – the same assignment GUIDs as seen in the policy namespace – and report on their overall compliance. Note: This GUID here should match the GUID we saw in policy but because my assignment was not mandatory I don’t have that GUID here. To illustrate I took this screenshot is from a system where the deployment was mandatory.
Also in this namespace is the CCM_TargetedUpdates class that will list out all targeted updates and their deployment details. 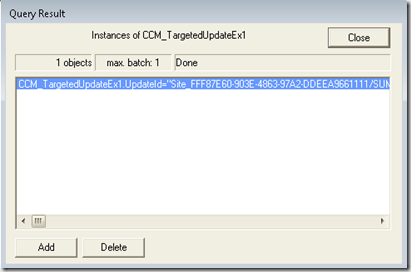
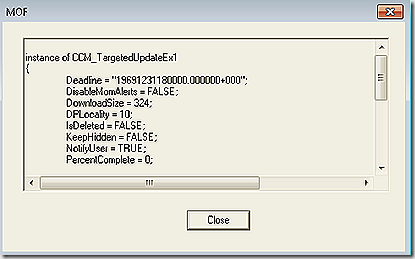
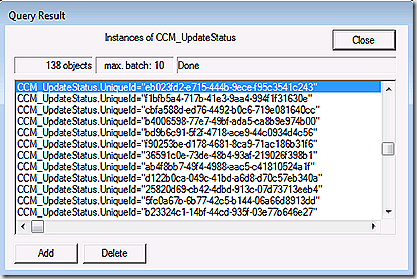
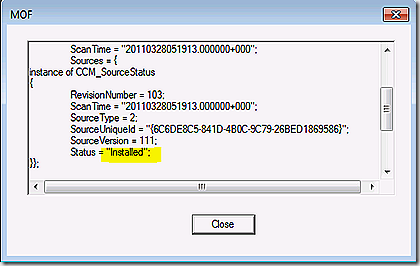
Lastly, we look in root\ccm\softwareupdates\updatesstore which contains the most recent status for all updates. Updates are listed by update GuID.
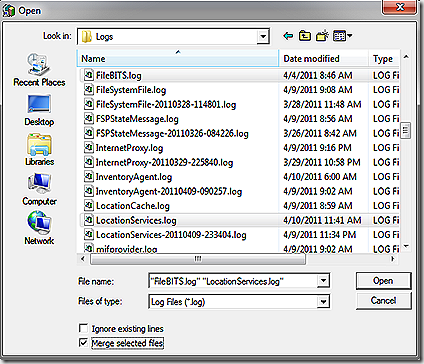
OK, almost done. Last thing. Earlier I mentioned that I used trace32 to merge various logs and watch the activity as different components interacted with each other. To do that you need to open trace32 itself – with no logs open – select file?open and navigate to your logs of interest, multi-select all that you want to see and then select the check-box to merge the logs. Once the logs are merged go down to the time stamp where you expect all of the action to start and enjoy!
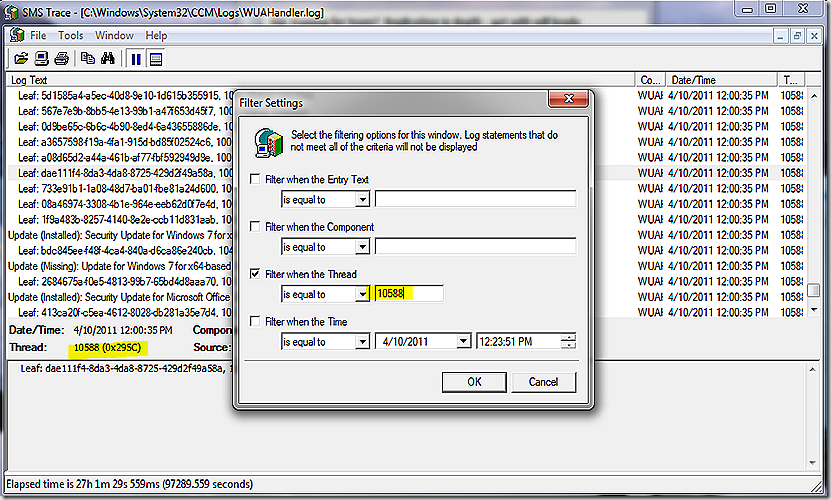
Another log reading trick that can be helpful for components where multiple threads are active at once is to find the activity where you want to focus investigation, look at the thread number and filter the log for just entries with the thread.
