Commercial Data Visualization Apps
There is a lot of focus on great consumer apps and in turn a lot of discussion on this topic. What are the most addicting games? What app will I use to take pictures, look at pictures, edit pictures, share pictures? What about music and video? As our team works with partners on great apps I thought it might be fun to start from another angle and take some time to talk about great commercial apps and some of the first trends we’re seeing on how people are approaching commercial apps for Windows 8. One of the primary pivots initially has been around Data visualization given the rich data sets associated with many commercial applications. We already have some great data visualization apps available on Windows 8, and they’ve really been designed to take advantage of the touch/tablet experience and provide a fluid interface that allows the user to sort through large data sets quickly, identify trends, and derive better insights from the data. I wanted to share some of my favorites with you below as they aren’t the apps you might look at every day, but when you harness the power behind them, they will really blow your mind.
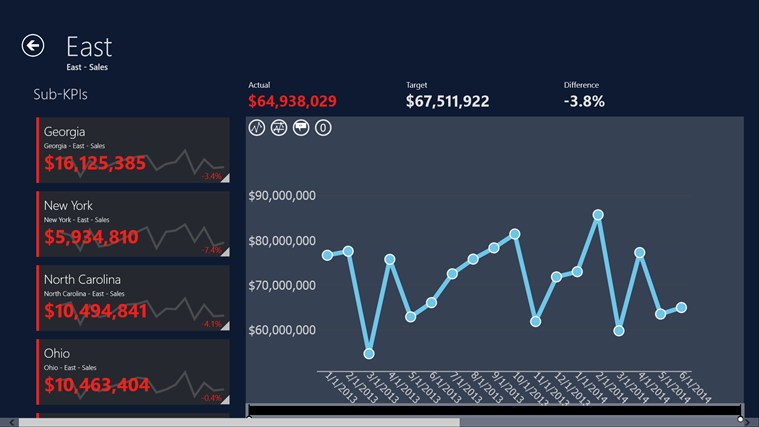
Spotfire Metrics is a business intelligence tool that delivers key performance indicators directly to your start screen. It’s visual and beautiful and when I use it I can quickly drill into the things I care about most. It takes just a touch to access my favorite KPIs, and then one more touch to deep-dive into the trends. With its server component, Spotfire Metrics can connect to data sources like Microsoft Excel, Microsoft PowerPoint, Microsoft SharePoint, Microsoft SQL, and Analysis Services, Oracle and SAP.
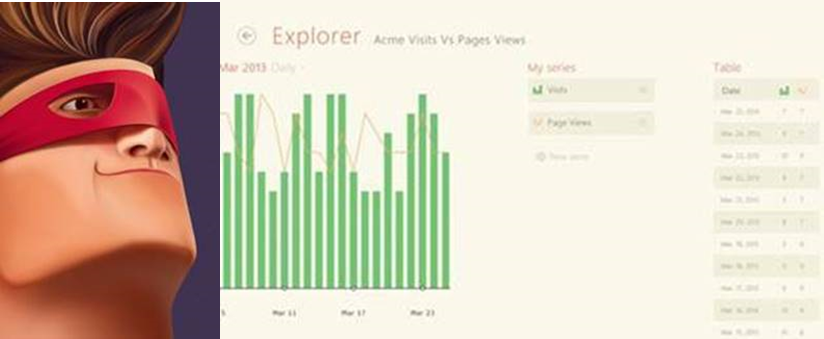
Captain Dash takes on the role of your friend that is “on a mission to rescue you from data confusion and frustration.” This app enables you to aggregate your data from Google Analytics, Twitter, Facebook, Foursquare and Microsoft Atlas into a single platform and produce on-demand, interactive dashboards, beautiful infographics, and KPI to optimize marketing decision making. Sometimes you just need that friendly face there to help get through all the data!
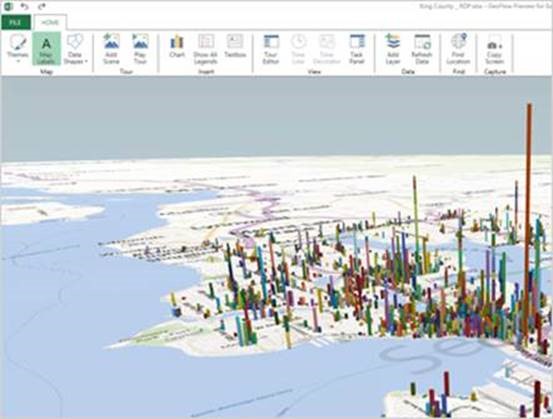
Power BI for Office 365 is definitely one of my favorite data visualization apps out there. It provides complete self-service BI for your on-premises and cloud-based data by using the new data discovery and analysis features in Excel with the collaboration capabilities in the new Power BI for Office 365 online service.
You’ll love how quickly this app sets up, and its low cost and simplicity. You can quickly create collaborative Power BI sites for your team to share live reports and custom data sets. It’s also easy to track usage to see who’s accessing the data and what data sets are most often used.
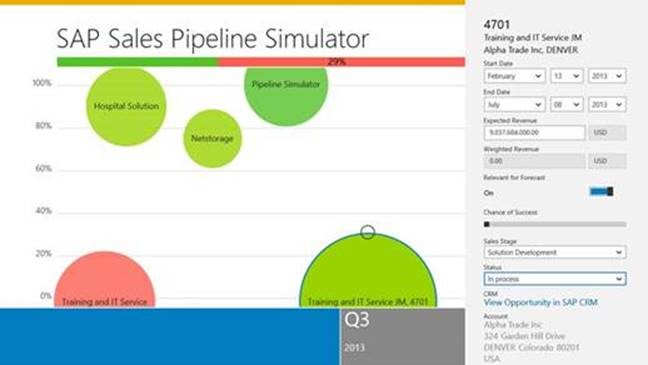
SAP Sales Pipeline Simulator accesses the SAP CRM application and allows sales reps to not only check their pipeline, but also to simulate changes to their pipeline and check how these changes affect their sales targets, right from their Windows tablet! Semantic zoom is enabled, allowing you to pinch and pull throughout the app, zooming in on the areas that matter most to you.
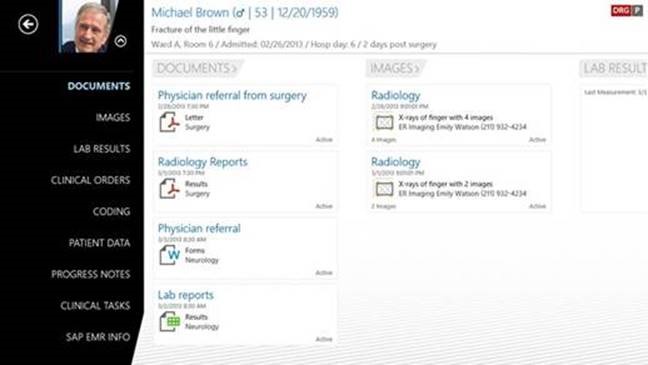
SAP EMR Unwired provides a new way to visualize data in a medical environment. With the SAP EMR Unwired mobile app for Windows tablets, physicians and nurses have easy, secure access to patient data right at the point of care. Caregivers can view patient test results and X-rays from within the app, enter clinical data and make notes on progress.
The “magic” is in how this app connects and pulls data from clinical back-end systems, including hospital information and imaging systems (PACS). The app helps the caregiver by displaying all of the patient's data on the Windows tablet in a clear and easy-to-read format.
So that is just a quick look at a few data visualization apps. There are a number more to take a look at in the Store and we’re continuing to grow the number of commercial apps, and of course those that companies are doing specific to their businesses (which don’t show up in the store, but are still impressive). Check them out and let me know what you think!
Cheers