Software Project Recovery is predictable
I often hear Agile and Project Recovery demeaned by those practicing more "formal" methodologies as unpredictable. Predictability is absolutely necessary to manage a project of any real size. Key indicators such as earned values cost and schedule variance measures tend to be variance from a well-known and largely linear baseline. The key point here is the expected trend being linear. Agile projects in general and Project Recovery efforts specifically have historically non-linear trends. As a Project Recovery Lead it is my job to provide my customers insight into the predicted trends, repeated reference to their place in the trend, and an understanding of the variance from the predicted trends. I don't do this so that they might help manage. I do it to prevent surprise.
So, here are a few trends I watch;
The Love Curve
The love curve is a personal favorite. It tracks the customers’ satisfaction with my efforts over the life of a Recovery effort.
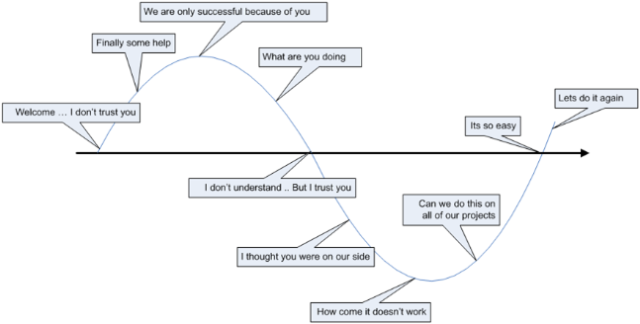
The main line represents time moving from left to right. Points along the curve above the line are happy things and points below the line are unhappy thing. Every project goes through this. The only variations are how the curve might stretch over time.
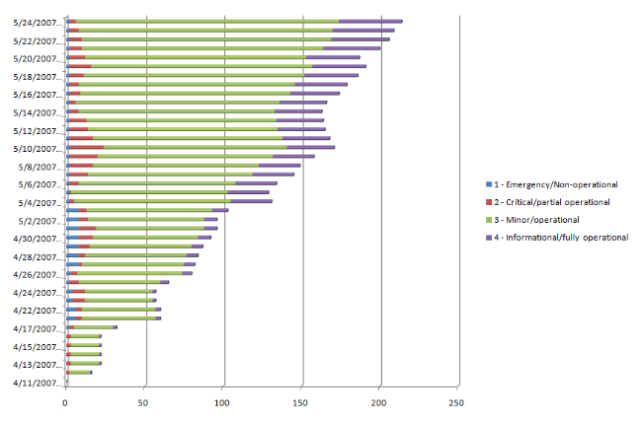
The Severity Wave
The Severity wave shows the defect trends over time. Using the following severity scale;
- Severity 1 defects cause complete solution failure stopping all test. These require immediate attention by all.
- Severity 2 defects block some test plans. These are serious defects and should be the top priority of whomever they are assigned to.
- Severity 3 defects are not blocking and are generally characterized as causing the test plan to return an unpredicted result.
- Severity 4 defects do not prevent the proper operation of the solution but should be addressed if possible.
- NT defects are Not Testable in the current release.
Sev 1 defects show up but not many and are close quickly. Sev 2 defects rise and fall with each iteration. Early testing will be blocked but resolution is a natural side effect of continuous development. Sev 3 defects are the vast majority and they will grow in number over time. And last, Sev 4 defects are volatile noise.
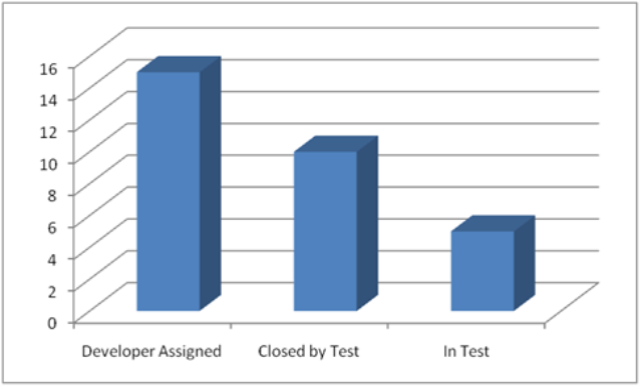
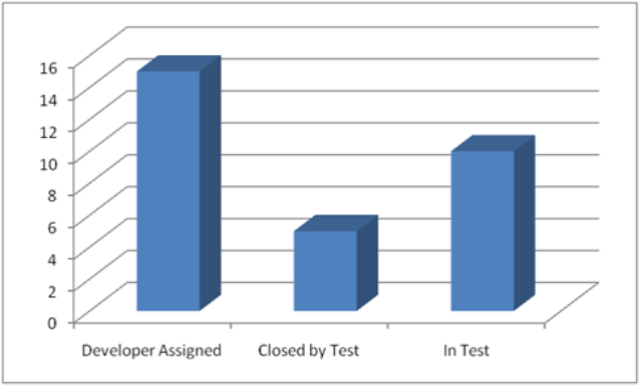
The Defects See-Saw
The Defects See-Saw is a daily measure of health. The is a natural flow between developers and testers that pivots on defects marked as resolved by the developers and not yet verified and closed by Test. Healthy flows look something like this;
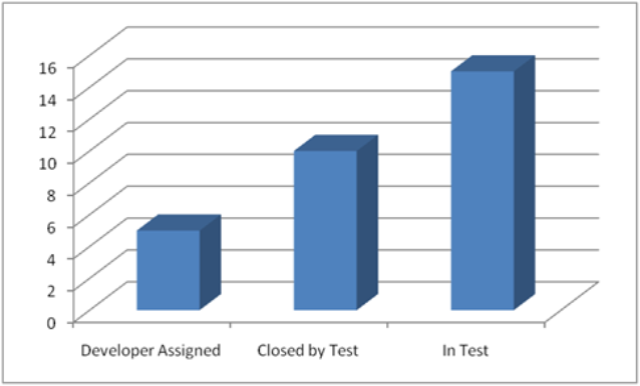
If things are going wrong you will see bottle necks such as;
I have a few others but I'll stop with these for now.
What trends are predictable on your projects?