How to use Windows or Windows Phone Store App Crash Dumps found on your Dev Portal
In this post, I will show you how to analyze Windows and Windows Phone Store apps crash dumps available on the developer portal, especially when you get nothing but an empty callstack in the excel file.
Thanks a lot to Rudy Huyn who gave me some of his dump files to illustrate the steps
Being pragmatic
Most of the time, a bug leading to a crash remains in an app because the dev just can’t reproduce it. Reproduction is the key : it’s about 80% of the job. Why ? Because once it’s done, you can then use the debug mode, with the comfort of your good old Visual Studio and its powerful debugging tools. Oh, and you still need to fix it of course ! But devs always find a way for that…that’s what we’re paid for : finding solutions ![]() .’ In the easy cases you will be able to fix the bug directly, and sometimes we will have to consider things in a different way and find other options to reach the goal - but that’s another story.
.’ In the easy cases you will be able to fix the bug directly, and sometimes we will have to consider things in a different way and find other options to reach the goal - but that’s another story.
To me, this is why the best way to consider crash dumps information when downloaded from the dev portal: it will not help you fix the bug itself, but it will help you reproduce it so that you can get the full debug story in Visual Studio instead of a skinny minidump.
Retrieving the crash information from the developer portal
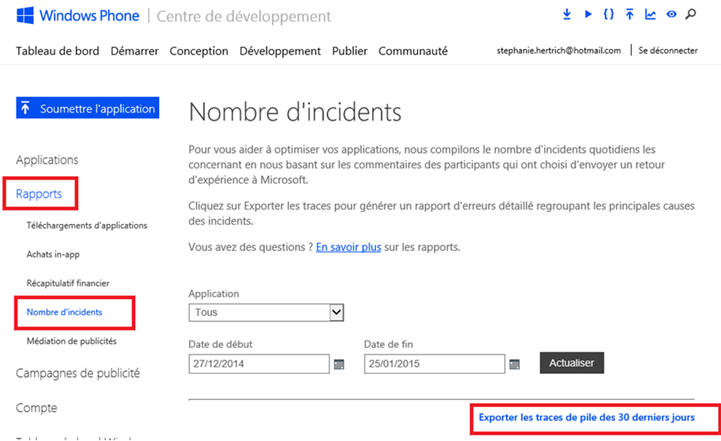
The first step is to get the excel file containing the last 30-days history of crash info. Go to the dev portal and follow these steps (the screenshot below is from the Windows Phone store but it’s quite the same on the Windows Store):
You will get an excel file with some information about each crash. The most interesting is the callstack of the managed thread that caused the crash.
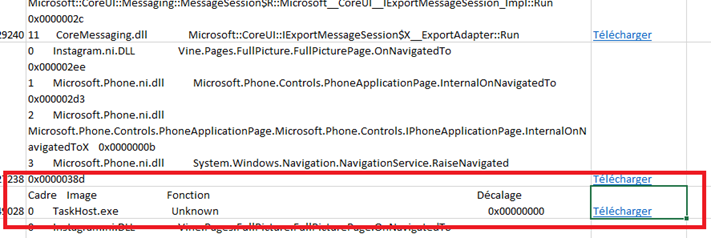
But to be able to get it, you will have to activate the edition mode of the excel document you just downloaded. If you don’t do that you won’t be able to expand the cell containing the whole callstack : you will see only 1 row like in the picture below.
Unfortunately, some of you folks certainly got stuck here thinking they can’t get more.
Sometimes you will be lucky
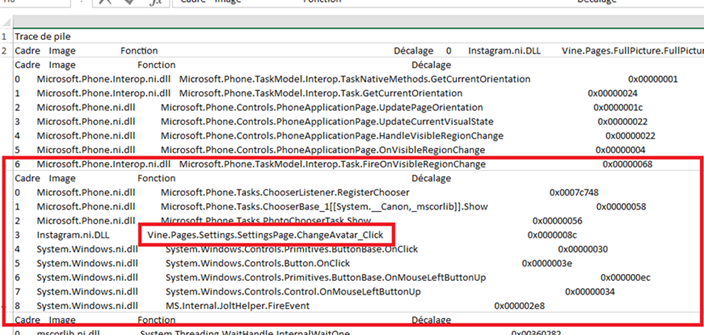
Double-clicking the callstack cell will expand it : if you are Lucky you will see several rows:
Here we can see that the crash is consequent to the update of the avatar in the settings. This is pretty explicit ! Great !
Sometimes you will get peanuts…
In the same file, one of the crash dump contains no callstack:
The good news is that you will be able to get it anyway, but you’ll need a few more steps to do that : click the download button on the right and save the .cab dump file on your disk.
Hello WinDbg !
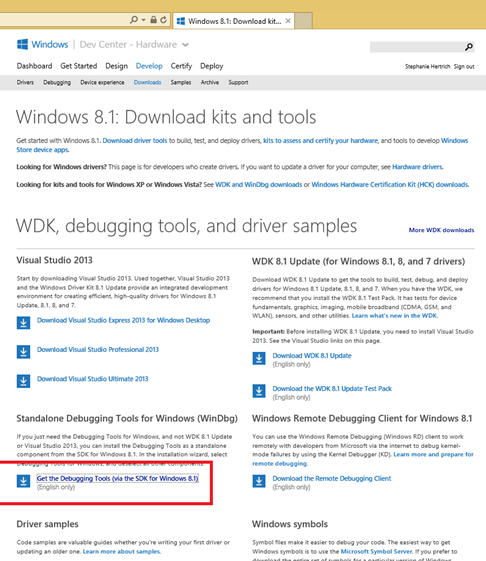
We will use WindDbg to open the .cab file. If WinDbg is not installed on your machine, you can download it from the WDK download page:
Configuring WinDbg
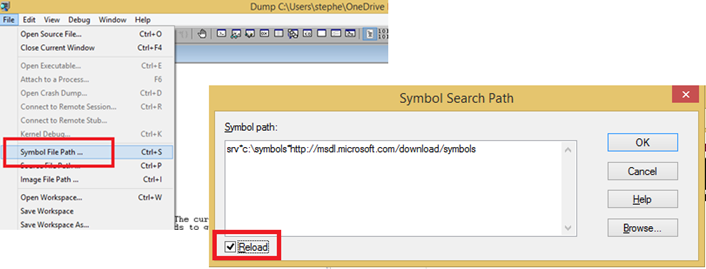
After starting WinDbg, you will need to set the symbols path.
Use the following syntax to tell WinDbg to use Microsoft public symbol server (https://msdl.microsoft.com/download/symbols) and to cache it to a local path (here c:\symbols but you can choose any)
srv*c:\symbols*https://msdl.microsoft.com/download/symbols
Important : If you already loaded the .cab file, don’t forget to check the reload checkbox.
Open the .cab
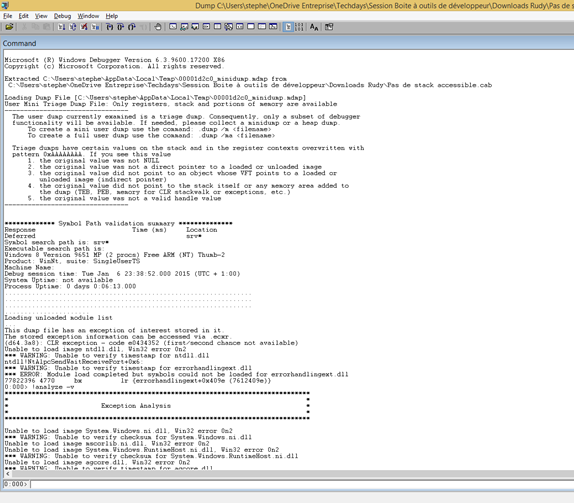
Use the File/Open crashdump command to load the .cab you downloaded. WinDbg will extract a mini-dump from it.
I won’t give you all boring detailed information WinDbg can get from the mini-dump, but just what you really need to debug the app.
Analyse
In the prompt, type the following command:
>!analyze –v
Now it’s time for you to get some coffee because this analyze may take some time (maybe up to 15/20 minutes). Don’t pay attention to the warnings.
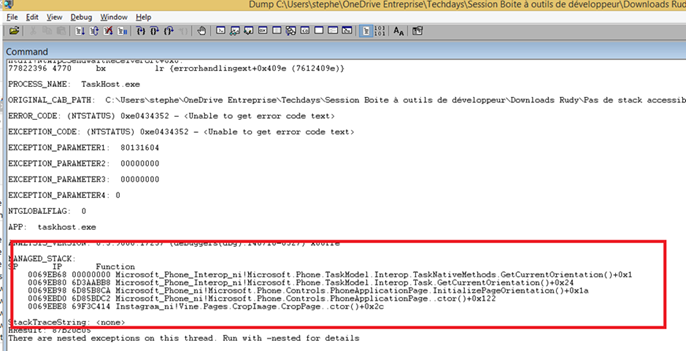
Once the processing phase is over (the prompt shows 0:000 again), you will be able to find a “MANAGED_STACK” section. This is what we are looking for ! In my case I can see that the crash is related to the crop functionality. Bingo ! Now it should be easy to reproduce the crash inside the app itself !
Other useful commands
Many other commands are available, here are a few nice ones:
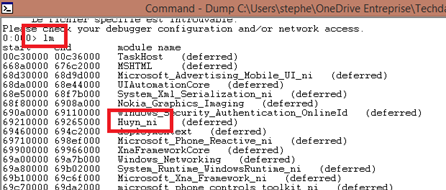
1. Listing loaded modules (dll)
> lm
2. Detailed information for a specific module
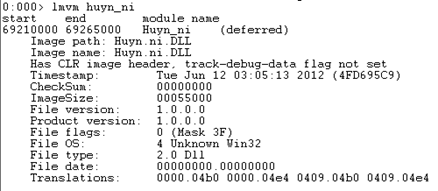
Nice to check if your app uses the appropriate version : you can even check the timestamp !
> lmvm Huyn_ni
3. Retrieving the callstack for all threads
The ~*e prefix is the selector applied to the !ClrStack command
> ~*e !ClrStack
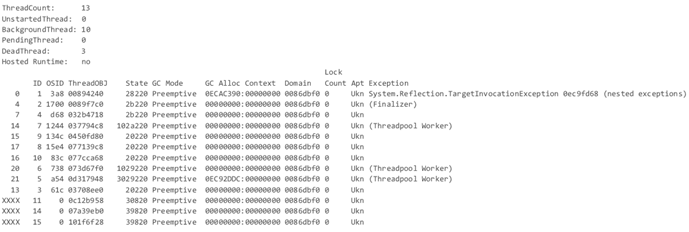
4. Listing all threads
> !threads
And more…
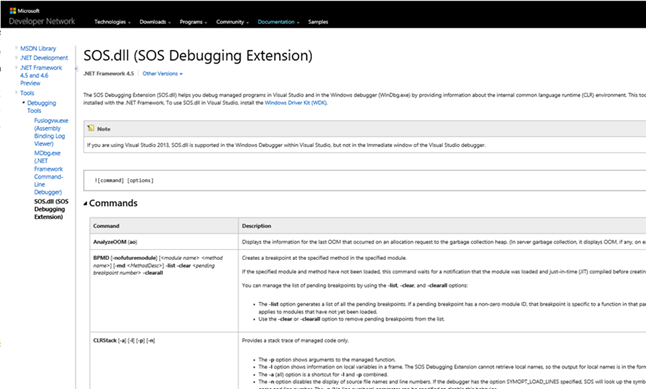
More commands are available, especially those coming with SOS extension loaded by WinDbg (the ones starting with “!”), the complete list is available here:
We just covered how to take advantage of the crash dumps available on the dev portal. This tutorial will help you even in case you get an empty call stack in the .xls file. We used WinDbg in this case, but in a very easy way : a couple of steps were enough to retrieved what caused the crash.
Happy debugging !
