Part3: Creating a Custom SSMA Report
In the last part of this installment, I will show an example of SSRS report using the data we parsed in part 2 and extracted from SSMA in part1. For this report, I would like to list all projects and its aggregate conversion rate, number of object, and number of errors. If there are multiple runs of assessment for a given project, I only want to show the latest result.
Example of the report is as follows:
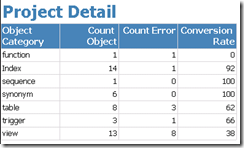
clicking on “orcl_OE” project, would take you to the detail report:
For each of the report above, I created a stored procedure to define the query. I also created two views as follows:
 CREATE VIEW vwLatestSSMAProjectSession AS
SELECT project, MAX(Session) as Session  from tblSSMAReport_Object GROUP BY Project
GO

CREATE VIEW vwSSMAReport AS
SELECT        obj.Name,
            obj.Path,
            obj.Project,
            obj.Session,
            obj.Category AS ObjectCategory,
            CAST(obj.ConvertedWithError as TINYINT) AS ObjStatus,
            msgdtl.code,
            msgdtl.description
FROM        dbo.tblSSMAReport_Object obj
INNER JOIN    dbo.vwLatestSSMAProjectSession ses on ses.Project = obj.Project and ses.Session = obj.Session
LEFT JOIN    dbo.tblSSMAReport_MessageDetails msgdtl on msgdtl.ObjectID = obj.ObjectID and msgdtl.Project = obj.Project and msgdtl.Session = obj.Session
 where  obj.Name is not null
 Go
vwLatestSSMAProjectSession identifies the latest session for each project. vwSSMAReport is the base query that join the data between the two tables created in part 2 and the view we just created. All the reports will use the same base query defines in this view to ensure consistency.
After the views are created, we can create the stored procedures:
 CREATE PROCEDURE sproc_getReportSummary AS

SELECT        Project,
            Replace(Session,'report_','') AS Session,
            COUNT(name) AS CountObject,
            SUM(Status) AS CountError,
            ((COUNT(name) - SUM(Status)) *100  /COUNT(name)) AS ConversionRate
FROM
(
            SELECT        rpt.Name,
                        rpt.Project,
                        rpt.Session,
                        rpt.ObjectCategory,
                        COUNT(DISTINCT  rpt.name) AS CountObject,
                        MAX( rpt.ObjStatus  ) AS Status
            FROM        dbo.vwSSMAReport rpt
            GROUP BY     rpt.Project,
                        rpt.Session,
                        rpt.ObjectCategory,
                        rpt.Name
) Data
GROUP BY    Project,
            Session
ORDER BY ConversionRate DESC
Go
 CREATE PROCEDURE sproc_getProjectDetail (@project varchar(255)) AS
 SELECT        Project,
            Replace(Session,'report_','') AS Session,
            ObjectCategory,
            COUNT(name) AS CountObject,
            SUM(Status) AS CountError,
            ((COUNT(name) - SUM(Status)) *100  /COUNT(name)) AS ConversionRate
FROM
(
            SELECT        rpt.Name,
                        rpt.Project,
                        rpt.Session,
                        rpt.ObjectCategory,
                        COUNT(DISTINCT  rpt.name) AS CountObject,
                        MAX( rpt.ObjStatus  ) AS Status
            FROM        dbo.vwSSMAReport rpt
            WHERE        rpt.Project = @project
            GROUP BY     rpt.Project,
                        rpt.Session,
                        rpt.ObjectCategory,
                        rpt.Name
) Data
GROUP BY    Project,
            Session,
            ObjectCategory
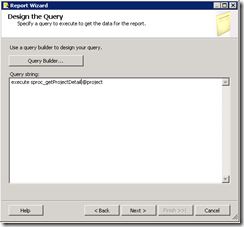
Create the report using the Report Wizard and specify connection information to the SQL Server database: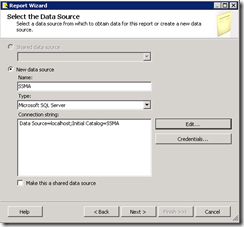
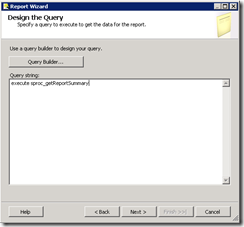
Specify "execute sproc_getReportSummary" as the query string
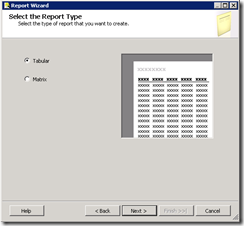
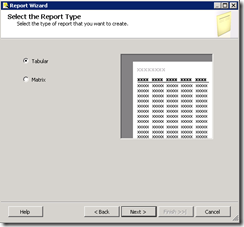
Accept the default Tabular report type:
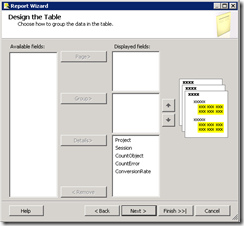
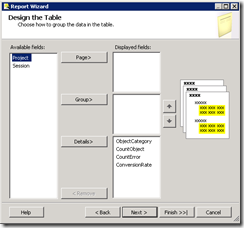
Move all the fields to the "Details" section:
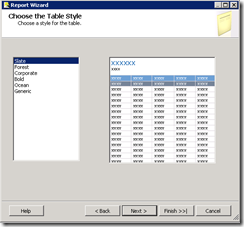
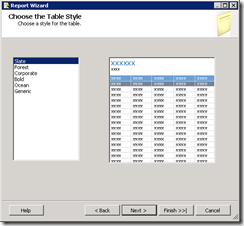
Choose the Table Style:
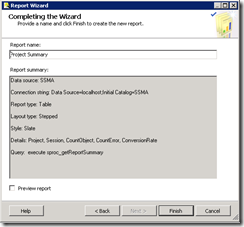
Name your report and click finish:
From the design window, drag "Data Bar" from the toolbox window onto ConversionRate cell.
Select the Data Bar Type
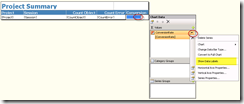
Click on the bar to display chart data dialog box then click on the arrow next to the ConversionRate. Select "Show Data Labels"
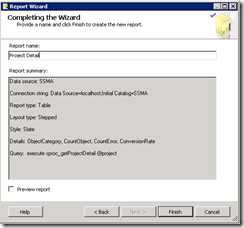
To create the Project Detail report, repeat the process and use the following as query string: "execute sproc_getProjectDetail @project"
Select the Report Type:
Move ObjectCategory, CountObject, CountError, and ConversionRate to the Details section:
Select the Table Style
Name your report and click Finish:
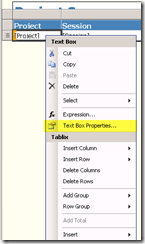
Return to the Report Summary, right click on the Project cell and select Text Box Properties:
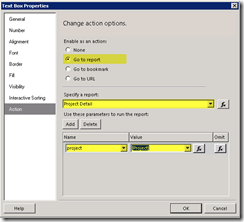
Go to Action tab, select "Go to report", select the report name, and add parameter as follows:
Click the preview tab on the Project Summary report and click one of the project:
The detail for the selected project should appear:
This conclude our 3 part series on creating custom SSMA report. Please check out the previous related posting on this topic:


![clip_image001[4] clip_image001[4]](https://msdntnarchive.blob.core.windows.net/media/MSDNBlogsFS/prod.evol.blogs.msdn.com/CommunityServer.Blogs.Components.WeblogFiles/00/00/01/39/83/metablogapi/1401.clip_image0014_thumb_426AD541.png)

![clip_image001[6] clip_image001[6]](https://msdntnarchive.blob.core.windows.net/media/MSDNBlogsFS/prod.evol.blogs.msdn.com/CommunityServer.Blogs.Components.WeblogFiles/00/00/01/39/83/metablogapi/0456.clip_image0016_thumb_1(DB3.png)