Troubleshoot Runaway Queries in SQL 2014 Using sys.dm_exec_query_profiles
Scenario
You are tasked to identify the bottleneck of a slow or problematic T-SQL query which either never finishes, takes many hours to complete, or fails after many hours (for example with a tempdb space error). You would like to view execution plan details and runtime statistics while the query is still executing.
The Challenge
At a very high level, there are two things you want to monitor when troubleshooting a long running query:
1. Statistics which show resources the query is using or resources the query is waiting on (for example via sys.dm_exec_requests, sys.dm_os_waiting_tasks, sys.dm_os_resource_semaphores, sys.dm_exec_query_memory_grants )
2. The query execution plan which shows the execution plan details and cardinality estimates.
We can collect the execution plan of a query using some the following methods:
- set showplan_xml on - this collects the execution plan with information only known at compilation time, such as estimated rows, estimated cost, estimated memory grant, estimated degree of parallelism, and plan shape.
- set statistics xml on (or extended event: query_post_execution_showplan) - This is only available upon query completion. It collects the execution plan with additional runtime statistics, such as # rows returned from a specific plan step, actual #of threads used throughout parallel operations, actual size of the memory grant, etc.
If the query never completes, you are met with some interesting troubleshooting challenges:
Many runtime execution statistics are not exposed until query completion. This includes Sys.dm_exec_query_stats, query I/O statistics (SET STATISTICS IO) , query CPU statistics (SET STATISTICS TIME) , and execution plan statistics (SET STATISTICS XML)
Those runtime stats are needed to identify any large discrepancies between the estimated cardinality and actual cardinality for an operation
If the query is complex, it may not be obvious which of the many tables, indexes, or operations involved is driving the long runtime
Running Sys.dm_exec_requests periodically can help us understand if there is a resource wait issue. But this DMV alone may not help us understand which part of the query we need to tune.
Solution
In SQL Server 2014, we have exposed a new capability which allows you to view runtime execution plan statistics via the sys.dm_exec_query_profiles DMV.
How It Works
1. Enable runtime execution plan statistics collection via "SET STATISTICS PROFILE ON" or "SET STATISTICS XML ON"
2. Run your query within the session in which execution plan statistics collection is enabled
3. You can now view runtime statistics about the query's execution plan via the sys.dm_exec_query_profiles DMV.
Example Walkthrough
I will step through an example in which viewing the estimated execution plan alone is not sufficient for identifying the bottleneck of a query. Note the sample code below may cause out of memory errors if @endValue is set too large.
(Note: to see the pictures below at a better resolution, please click on the picture and this will open a link to the source image.)
1. Create sample db + objects. Increase @endValue variable to increase size of the data set.
use master
GO
create database testDB_IDBottleneck;
GO
use testDB_IDBottleneck
GO
create table t1(c1 int, c2 char(300), c3 varchar(400), c4 int, c5 int);
create table t2(c1 int, c2 char(300), c3 varchar(400), c4 int, c5 int);
create table t3(c1 int, c2 char(300), c3 varchar(400), c4 int, c5 int);
create table t4(c1 int, c2 char(300), c3 varchar(400), c4 int, c5 int);
create table t5(c1 int, c2 char(300), c3 varchar(400), c4 int, c5 int);
GO
insert into t1 values (-1, replicate('A', 300), replicate ('B',400), -1,-1) ;
insert into t2 values (-1, replicate('A', 300), replicate ('B',400), -1,-1) ;
insert into t3 values (-1, replicate('A', 300), replicate ('B',400), -1,-1) ;
insert into t4 values (-1, replicate('A', 300), replicate ('B',400), -1,-1) ;
insert into t5 values (-1, replicate('A', 300), replicate ('B',400), -1,-1) ;
GO 5
--increase @endValue to increase size of the data set
declare @ctr int=1, @endValue int=10001;
while (@ctr <@endValue )
BEGIN
insert into t1 values (@ctr, replicate('A', 300), replicate ('B',400), @ctr%500,@ctr%2);
insert into t2 values (@ctr, replicate('A', 300), replicate ('B',400), @ctr%500,@ctr%2);
insert into t3 values (@ctr, replicate('A', 300), replicate ('B',400), @ctr%500,@ctr%2);
insert into t4 values (@ctr, replicate('A', 300), replicate ('B',400), @ctr%500,@ctr%2);
insert into t5 values (@ctr, replicate('A', 300), replicate ('B',400), @ctr%500,@ctr%2);
set @ctr +=1;
END
GO
create index t1c5 on t1(c5) include (c3);
create index t2c5 on t2(c5) include (c3);
create index t3c5 on t3(c5) include (c3);
create index t4c5 on t4(c5) include (c3);
create index t5c5 on t5(c5) include (c3);
GO
2. Create table valued function: f4
create function f4 (@val int)
returns @t4 table (c3 varchar(400), c5 int)
as
BEGIN
insert @t4 select c3, c5 from t4 where c5 = @val
return
END
3. View the estimated execution plan for the problematic query. Note the query has three sections, the third section uses the f4 function.
set showplan_xml on
GO
declare @c5 int=-1
--SECTION 1 -------------------
-- returns 25 rows
select t1.c5, t1.c3 from t1
join t2 on t1.c5 = t2.c5
where t2.c5=@c5
union
--SECTION 2 -------------------
-- returns 5000 rows
select t3.c5, t3.c3 from t3 where t3.c5=0
union
--SECTION 3 -------------------
-- returns 25,000,000 rows
select f4_t.c5 , f4_t.c3
from f4(0) f4_t
join t5 on f4_t.c5 = t5.c5
GO
GO
set showplan_xml off
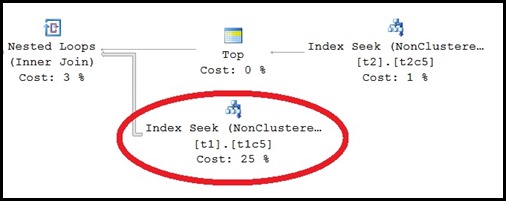
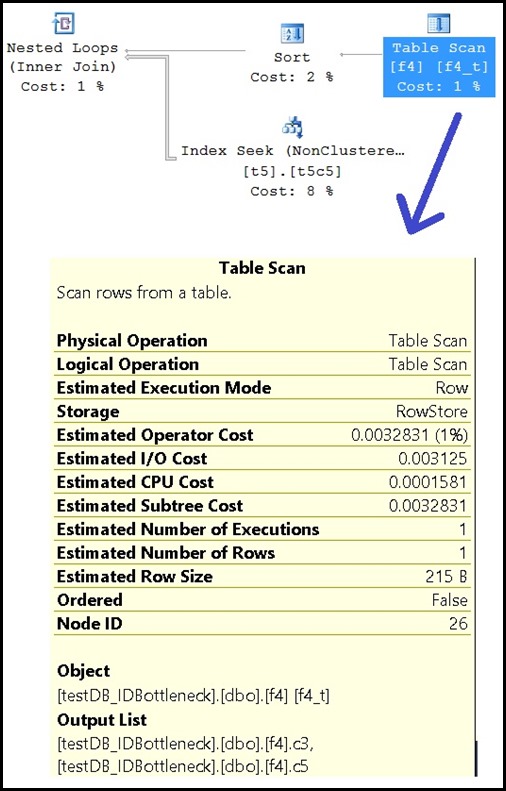
4.a. Based on the estimated plan it seems sections 1 and 2 (t1-t3 operations) are the most expensive part of the query. Section 3 (f4,t5 operations) appears to be insignificant with respect to cost.

4.b.The reason for this is the estimated rows for f4 (and hence t5 - because t5 is being joined with f4) is very low.
5. Now run the query with runtime execution plan statistics collection enabled
set statistics xml on
go
declare @c5 int=-1
--SECTION 1 -------------------
-- returns 25 rows
select t1.c5, t1.c3 from t1
join t2 on t1.c5 = t2.c5
where t2.c5=@c5
union
--SECTION 2 -------------------
-- returns 5000 rows
select t3.c5, t3.c3 from t3 where t3.c5=0
union
--SECTION 3 -------------------
-- returns 25,000,000 rows
select f4_t.c5 , f4_t.c3
from f4(0) f4_t
join t5 on f4_t.c5 = t5.c5
GO
set statistics xml off
6. Run the DMV query in a separate session, while the query is executing
-- User db context is not required,
--but setting db context to user db to correctly populate object_name function
use testDB_IDBottleneck
go
while (1=1)
begin
if exists (select * from sys.dm_exec_query_profiles p where p.session_id = 52)
select top 5 p.plan_handle, p.physical_operator_name, object_name(p.object_id) objName
, p.node_id, p.index_id, p.cpu_time_ms, p.estimate_row_count
, p.row_count, p.logical_read_count, p.elapsed_time_ms,
p.read_ahead_count, p.scan_count
from sys.dm_exec_query_profiles p
where p.session_id = 52
order by (p.row_count-p.estimate_row_count) + p.logical_read_count desc
waitfor delay '0:0:10'
End
7.a. Observe DMV query results

7.b. Observations from DMV query
- The DMV output shows top I/O operations are against table t5.
- In addition, node_id 27 from the xml execution plan seems to be driving the I/O activity.
- Also note there is a large discrepancy between estimated rows and actual row count for Node_id 27
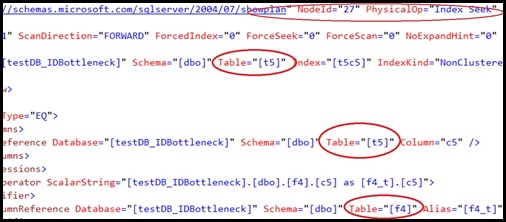
7.c. You can further explore the node (node_id 27) which is driving the I/O by querying the cached plan details. You would need to plug in the plan_handle and node_id values from step 7.a above.
declare @varplanhandle varbinary(64) =0x06000500EBEC300670D506D50200000001000000000000000000000000000000000000000000000000000000;
declare @varnodeid int=27;
WITH XMLNAMESPACES(N'https://schemas.microsoft.com/sqlserver/2004/07/showplan' as qp), cte1
as
(
SELECT
CachedXmlPlan
,CachedXmlPlan.value('(//qp:QueryPlan//node()[@NodeId=sql:variable("@varnodeid")]/@NodeId)[1]','nvarchar(max)') PlanNodeId
,CachedXmlPlan.value('(//qp:QueryPlan//node()[@NodeId=sql:variable("@varnodeid")]/@LogicalOp)[1]','nvarchar(max)') PlanNodeLogicalOp
,CachedXmlPlan.value('(//qp:QueryPlan//node()[@NodeId=sql:variable("@varnodeid")]/@PhysicalOp)[1]','nvarchar(max)') PlanNodePhysicalOp
,CachedXmlPlan.value('(//qp:QueryPlan//node()[@NodeId=sql:variable("@varnodeid")]/@EstimateRows)[1]','nvarchar(max)') PlanNodeEstimateRows
,CachedXmlPlan.value('(//qp:QueryPlan//node()[@NodeId=sql:variable("@varnodeid")]/@EstimatedTotalSubtreeCost)[1]','nvarchar(max)') PlanNodeEstimatedTotalSubtreeCost
,CachedXmlPlan.value('(//qp:QueryPlan//node()[@NodeId=sql:variable("@varnodeid")]/@TableCardinality)[1]','nvarchar(max)') PlanNodeTableCardinality
,CachedXmlPlan.value('(//qp:QueryPlan//node()[@NodeId=sql:variable("@varnodeid")]/@Parallel)[1]','nvarchar(max)') PlanNodeParallel
,CachedXmlPlan.value('(//qp:QueryPlan//node()[@NodeId=sql:variable("@varnodeid")]/@EstimateRebinds)[1]','nvarchar(max)') PlanNodeEstimateRebinds
,CachedXmlPlan.value('(//qp:QueryPlan//node()[@NodeId=sql:variable("@varnodeid")]/@EstimateRewinds)[1]','nvarchar(max)') PlanNodeEstimateRewinds
,CachedXmlPlan.query('(//qp:QueryPlan/descendant::node()[@NodeId=sql:variable("@varnodeid")])') PlanNodeXmlSnippet
FROM
( -- Cast the target_data to XML
SELECT query_plan CachedXmlPlan
FROM sys.dm_exec_query_plan(@varplanhandle)
) as t1
)
SELECT * from cte1
7.d. Sample cached plan query output


8. Why is the estimated rows so low for TVF f4 ?
Multi-statement TVF's in general give very low cardinality estimate. See blog post https://blogs.msdn.com/b/psssql/archive/2010/10/28/query-performance-and-multi-statement-table-valued-functions.aspx for more details.
9. To resolve the performance issue with this particular query you would make the function f4 inline:
-- Per https://msdn.microsoft.com/en-us/library/ms186967.aspx
-- ALTER FUNCTION cannot be used to change an inline function to a multistatement function, or vice versa
-- Therefore, you must first drop f4 and then recreate it as an inline function:
create function f4 (@val int)
returns table
as
RETURN select c3, c5 from t4 where c5 = @val
GO
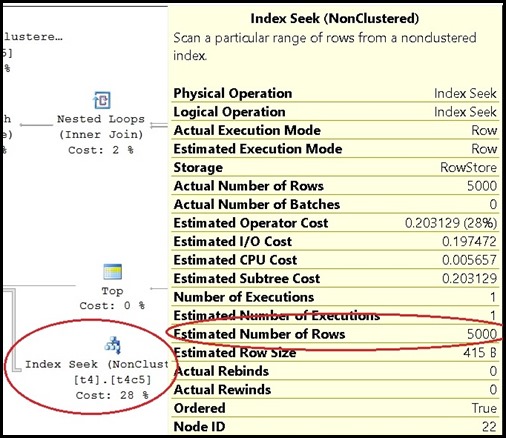
10. Note that SQL now is able to estimate cardinality for f4 and chooses a much faster execution plan.

References
- sys.dm_exec_query_profiles (Transact-SQL) https://msdn.microsoft.com/en-us/library/dn223301.aspx
Fany Carolina Vargas | SQL Dedicated Premier Field Engineer | Microsoft Services
