Ask Learn
Preview
Please sign in to use this experience.
Sign inThis browser is no longer supported.
Upgrade to Microsoft Edge to take advantage of the latest features, security updates, and technical support.
Note
Access to this page requires authorization. You can try signing in or changing directories.
Access to this page requires authorization. You can try changing directories.
Checking file performance and comparing performance characteristics between SQL Server database engines in Azure cloud and your on-premises environment might be tricky and require some better knowledge of DM objects. In this post, you will see how to use one open-source library that can help you to analyze and compare file performance.
SQL Server and Azure SQL Managed Instance enable you to measure IO characteristics of your database files using sys.dm_io_virtual_file_stats DM object. However, you must be aware that this DM returns cumulative values that should be sampled and you would need to calculate the differences in IO stats between two period of times. If you need to extract information from this DM object, you should read the following articles:
If you don't have prepared scripts you can use the following open-source library: https://github.com/JocaPC/qpi where you have some useful prepared views that can help you analyze your file latency. This is a helper T-SQL library that enables you to:
As a first step you should install QPI library on your Managed Instance/SQL Server. Go to installation section and choose the version of QPI library depending on your SQL Server version. Only versions higher than SQL Server 2016 are supported because it uses SQL Server 2016 temporal tables to store the history of IO statistics.
This is plain T-SQL script that you can review to make sure that there is nothing dangerous inside.
This script will add a set of views/procedures in QPI schema in your database.
First you need to take a snapshot of the current values in sys.dm_io_virtual_file_stats DM object using the following command:
EXEC qpi.snapshot_file_stats;
This is the baseline for IO statistics and you can get the cumulative/average values until this point. Now you need to keep your workload running until the moment where you want to measure IO performance using the following view:
SELECT * FROM qpi.file_stats;
In the results of this view you can find information about the size of each file, IOPS, throughput, latency, etc.
You can also get the IO statistics in the current database:
SELECT * FROM qpi.db_file_stats;
The results are shown on the following image:
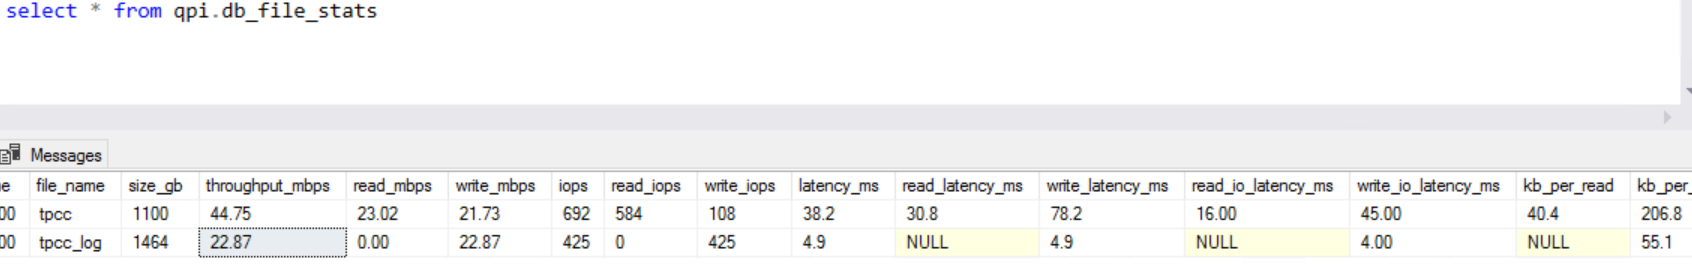
Most of the columns are self-explanatory, but there is difference in the following two:
You can also get the file statistics from some point in time in the past (make sure that you had done snapshot before this pint in time):
SELECT * FROM qpi.file_stats_as_of( <some date> );
If you are comparing IO performance results on Managed Instance and your on-prem or Azure SQL VM (IaaS) try to compare the results from this query in order to get the consistent results and fair comparison.
QPI is a set of useful scripts that can help you to more easily analyze performance of your database files.
QPI is open-source library and if you find any issue in the functions feel free to post the bug submit or pull request with a fix.
Please sign in to use this experience.
Sign in