Troubleshooting Error 511 using XEvents
Now that we have XEvents in SQL Server 2008 and above, some of the issues that required us to capture SQL Server dumps or Profiler traces while reproducing an issue are passé. Move over DumpTrigger and Profiler, XEvents is here to replace you!
Now to begin the story about why I am writing this blog post… Recently, I was involved with troubleshooting a bunch of Error: 511 on multiple SQL instances ranging from SQL Server 2005 to SQL Server 2008. Here is a sample error message:
Msg 511, Level 16, State 1, Line 1
Cannot create a row of size 9555 which is greater than the allowable maximum row size of 8060.
One such customer issue had me jumping through hoops to find out just the query which raised this particular error. The reason for that was the application being used by the customer was a vendor app which just threw back the SQL exception number and the error text. So, I had to use our age-old friend SQL Profiler to capture a trace with the following events: Errors and Warnings – All events, Showplan All (shows the estimated plan) event and Statement level events. The profiler trace helped me narrow down to the query which was raising the error. It was a simple SELECT query with a WHERE and ORDER BY clause and the data being selected didn’t overshoot the rowsize limitations. Hmm… Now what?!?! I then had to set SQL Server to generate a dump using DBCC DUMPTRIGGER.
-- To set dump trigger
dbcc dumptrigger ('SET',511)
-- To clear dump trigger
dbcc dumptrigger ('CLEAR',511)
After this the error was generated again, which created a mini-dump file in the SQL Server LOG folder. On analysis of the dump, I found that the issue was occurring while trying to insert a row into a SORT table while executing the query. When I went back to the profiler trace, I found that the estimated plan (note that a Showplan Statistics Profile profiler event will NOT give you the plan because the query always fails to complete) had a SORT operation. We then worked on removing the SORT by creating a non-clustered index on the SORTing columns or breaking the query into smaller parts so that the internal SORT table that is built to perform the ORDER BY operation is not very wide in size. The table had over 250+ columns with most of the columns having variable length data of the type varchar(max) . We were able to identify multiple workarounds to move forward on the issue but it took us some time to start from identifying the query, the estimated query plan and the internal operation took us multiple iterations.
It got me thinking how the rigmarole of events could be reduced on SQL Server 2008 with XEvents. I used the following T-SQL script to create an XEvent session to capture the data mentioned in the comments of the T-SQL script below:
-- create the XEvent session
create event session xEvents_Session on server
add event sqlserver.error_reported
(
action
(
sqlserver.session_id, -- SPID which raises the error
sqlserver.sql_text, -- T-SQL query which encountered the error
package0.collect_system_time, -- Time when the exception occurred
sqlserver.username, -- Name of the user that reported the error
sqlserver.client_app_name, -- Client application name
sqlserver.client_hostname, -- Host which initiated the query
sqlserver.database_id, -- Database against which the query was being executed
sqlserver.plan_handle, -- Plan handle which can be used to retrieve the graphical plan
sqlserver.tsql_stack, -- T-SQL stack for extended debugging purposes
package0.callstack -- Callstack for extended debugging purposes
)
where sqlserver.error_reported.error = 511
and package0.counter <= 5
)
add target package0.ring_buffer
with (max_dispatch_latency=1seconds)
GO
-- start the tracing
alter event session xEvents_Session on server state = start
To check if there are any occurrences of the error, execute the following query:
-- get the information from the target after the issue occurs
select CAST(xet.target_data as xml)
from sys.dm_xe_session_targets xet
join sys.dm_xe_sessions xe
on (xe.address = xet.event_session_address)
where xe.name = 'xEvents_Session'
This will provide you with an XML document which will contain the above mentioned details for each occurrence of Error: 511 on the server (for the last 5 occurrences as per the XEvent session configuration). The XML output will give you all the information that you need to troubleshoot the issue. I shall now point out some gotchas in the XML output:
<action name="collect_system_time" package="package0">
<type name="filetime" package="package0" />
<value>129282258745372637</value>
<text>2010-09-06T05:51:14.537Z</text>
</action>
The filetime is always displayed in UTC format. So, you will have to add/subtract the necessary number of hours as per your timezone.
<action name="plan_handle" package="sqlserver">
<type name="unicode_string" package="package0" />
<value><plan handle='0x060020005F24AA1A4061F42A010000000000000000000000'/></value>
<text />
</action>
The plan handle that is obtained can be used to retrive the query plan using the following T-SQL code:
select CAST(query_plan as XML)
from sys.dm_exec_text_query_plan(0x060020005F24AA1A4061F42A010000000000000000000000,0,-1)
If the plan is flushed out of the cache, then you will get a null output. So, the idea would be to capture the plan soon after the issue has been reproduced. Click on the XML generated as the output and that will give the graphical version of the query plan:
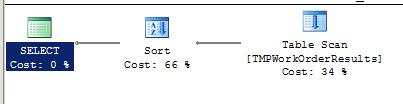
Notice above that there is a SORT operation in the plan which I had mentioned earlier in the post. The XML generated as part of the XEvent tracing will also give you the callstack which can be used to find out which function actually failed.
Once you have finished collecting the data you require, you can STOP the XEvent trace and drop the session definition using the following commands:
-- stop the session and drop the event definition from the server
alter event session xEvents_Session on server state = stop
drop event session xEvents_Session on server
If you are hitting this error while performing an internal operation, then this issue is by-design. The options to resolve the issue are:
1. Re-write the query which is running into the 511 error while performing an internal operation like a SORT or HASH MATCH in such a way that the plan doesn't have the SORT/HASH MATCH operation.
2. Use plan guides from a working plan for this query. This might affect the query performance but will not cause the query to error out.
3. Use index hints to rule out the SORT/HASH operations.
Now that you are equipped with the XEvent tracing mechanism, you can troubleshoot 511 errors without having to capture a mini-dump or profiler traces.
Regards,
Amit Banerjee
SEE, Microsoft SQL support