"Show Server Trace" Feature for SQL Server 2005 to analyze Stored Procedure and T-SQL Execution
Many of you might be missing the "Show Server Trace" feature of SQL Server 2000 Query Analyzer in SQL Server 2005 Management Studio.
As per the request filed in Microsoft Connect, the feature was introduced with a little tweak where by you can press CTRL + ALT + P key sequence within Management Studio to launch Profiler which uses "TSQL_SPs" template and filters the trace to current SPID in SSMS and shows the execution details of specific query or stored procedure run from the Management Studio.
This is specifically helpful when you execute stored procedures and you want to know the statement level details inside the stored procedure.
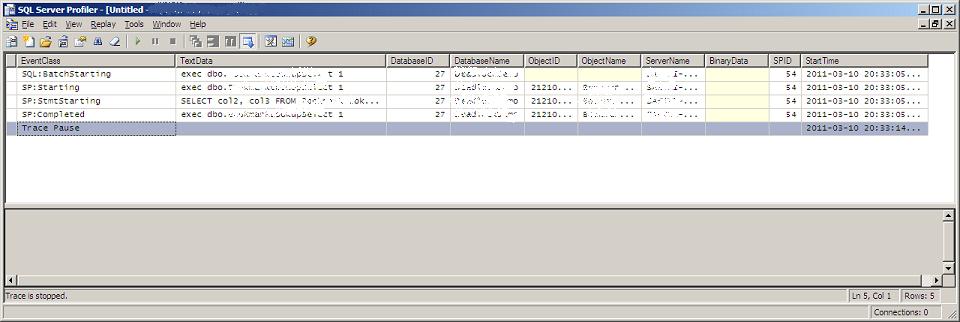
Here is a screenshot of Profiler trace which shows the statement level details when I ran a stored procedure
Definitely a feature worth to try!