Introduction to Showplan
Showplan is a feature in SQL Server to display and read query plans. While some of you may already be very familiar with Showplan, it is one of the most important diagnostic tools that we use in the query processing team to locate and identify problems, and therefore deserves some extra exposure. Being able to collect, read, and understand Showplan data is a critical skill to have, and one which we plan to blog about a fair bit. Consider this an introductory posting to cover some of the basics which we will drill into more in further posts.
We generate two types of Showplans in SQL Server, one at query compilation time (when an optimized query plan is produced) and the second at query runtime (when the optimized query plan is executed). The former allows you to see the compiled query plan in its entirety, as well as a ton of useful information about each operator in the plan. The runtime plan, often referred to as query execution “statistics”, enables you to collect actual metrics about the query during its execution, such as its execution time and actual cost.
Showplan and statistics information can be extracted in two ways from the server, 1) using query SET options, 2) using Profiler Trace events. The various SET options available are:
· Legacy Showplan
o Compile Time: SET SHOWPLAN_ALL ON or SET SHOWPLAN_TEXT ON
o Runtime: SET STATISTICS PROFILE ON
· Showplan XML (Preferred)
o Compile Time: SET SHOWPLAN_XML ON
o Runtime: SET STATISTICS XML ON
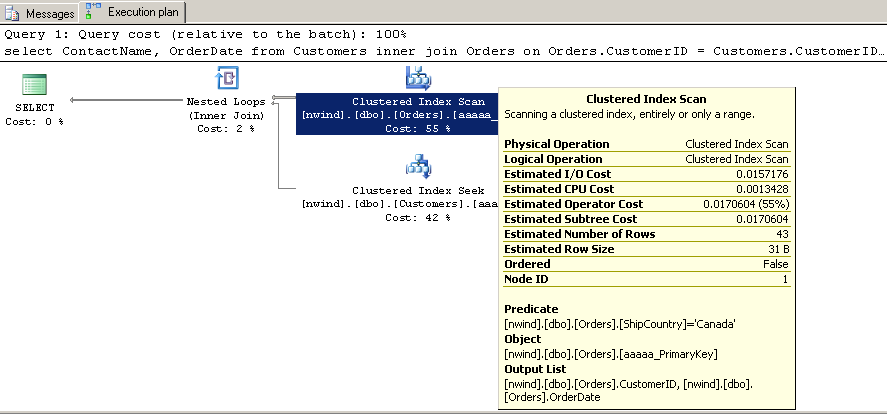
SQL Server Management Studio (SSMS) uses Showplan to display a graphical representation of the query plan. A graphical view of the query plan for the following query on the ‘nwind’ database is shown in the picture below.
-- Query: select customer name and order date for orders placed by customers in Canada
use nwind
go
select ContactName, OrderDate
from Customers inner join Orders
on Orders.CustomerID = Customers.CustomerID
where Orders.ShipCountry = 'Canada'
go
(See the attached .bmp file for a picture of this showplan)
In SSMS, to view the graphical plan, click on the Execution Plan tab in the Results Pane. The graphical plan is read from top-to-bottom, right-to-left. When you select any operator in the query tree or simply hover the mouse on it, you will see a tooltip that describes the operator. It displays the Query Optimizer cost estimates (operator and subtree costs, number of rows, row size, etc.) and additional information like output columns, predicates, etc. The detailed operator information is shown in the Properties window (View --> Properties Window), which is usually displayed on the extreme right frame in SSMS.
To save the graphical showplan to a file you can right click on the Execution Plan and select 'Save Execution Plan As'. The query plan is saved with extension '.sqlplan' and can be reloaded into SSMS anytime, sent via email, etc.
Showplan output can be generated in text, grid or XML formats. The XML format was introduced in SQL Server 2005 which we refer to as “Showplan XML” and the other formats as “Legacy Showplan”. In the next posting we will describe how to generate and analyze Showplan XML.
- Steve and Gargi