Early Customer Experiences with SQL Server R Services
Reviewers: Dotan Elharrar, Sanjay Mishra, Mike Ruthruff, Umachandar Jayachandran, Jeannine Nelson-Takaki
SQLCAT and the SQL Server product team deeply engaged with many early adopter customers over the last year who were interested in actively testing SQL Server 2016 R Services across a variety of scenarios. These customers saw significant benefits from moving their legacy code to SQL Server R Services. This blog post provides a mosaic-view of the early adopter customer experiences along with common issues they faced and recommendations on how to avoid common pitfalls.
But first…
This blog post makes some assumptions around your familiarity with SQL Server R Services. If the topic is entirely new to you, we recommend the following resources in order to get familiar with the SQL Server R Services feature landscape:
In-database Advanced Analytics with R in SQL Server 2016: Basic overview of SQL Server R Services
Getting Started with SQL Server R Services: Books Online, core starting reference
Advanced Analytics with R and SQL: Video from Build conference
SQL Server R Services Tutorials: Books Online tutorials for both the data scientist and database developer audiences
Architecture Overview (SQL Server R Services)
For the architecture overview, be sure to review all three sub-topics – including “R Interoperability in SQL Server R Services”, “New Components in SQL Server to Support R Services”, and the “Security Overview”.
What scenarios did customers want to address?
Early adopter customer industries varied significantly and included energy, investments, credit, health care, real estate, accounting and audit software. Specific scenarios included:
- Assessing customer and business risk factors.
- Predictive maintenance of company machinery.
- Predictive marketing and campaign optimization.
- Increasing the efficiency of inventory scheduling, ensuring that inventory doesn’t go to waste and that staffing levels are appropriate.
- Fraud detection.
- Sales forecasting.
- Product valuation based on comparative products and recent sales history.
- Product pricing recommendations.
Several customers had existing R solutions already in-use, although there was one customer who had their existing linear regression solution implemented via SSAS \ Data Mining Models and SQL Server, and wanted to consolidate down to a single solution using SQL Server R Services.
Why are customers interested?
The motivations behind early adopters exploring SQL Server R Services clustered around the following themes:
- Legacy performance issues. For this theme, the customer uses R today – but the existing process was too slow and was not scaling sufficiently to meet business demands. The reasons for “slow” varied across customers – but often included:
- The overhead of pulling large data sets from a remote SQL Server instance to a data scientist workstation (network latency for large result sets). For example, one data scientist team had exploration activities taking days due to data set size and locality.
- Throughput limits due to single-threaded open source R function usage.
- Memory constraints of open source R functions (Open-R functions requiring all data in memory in order to process, and no streaming capabilities). For one customer, they were unable to perform a linear model operation against 100 million rows and 25 attributes due to out-of-memory errors on the analytics server.
- Difficulty in moving an R solution to production. Several of our early adopter data scientists and statisticians used R as their primary tool, however once they finalized a solution, in order to move to production some of our early adopter customers had to rewrite their R code to another language in order to run in production. This re-coding was often performed by a different team (for one customer this was a full re-write to Java). This re-write takes time and is error-prone. Related to this – we had some customers that had to cobble together multiple technologies in order to provide a single end-to-end solution, so complexity and supportability was a related pain-point.
- Inefficiencies and communication gaps between the data scientist and database engineer teams. Some of our customers described how they used R in isolation from the SQL Server database engineer teams. With the two teams not always communicating, the data scientist would write R code where procedural T-SQL would have been a better choice and vice-versa. With minimal communication happening between the two roles - data may also get scrubbed independently and redundantly by various data scientists instead of leveraging a centralized data source that is already pre-processed by the database engineering team. We also found that most database engineers were not familiar with R, classic statistics and machine learning concepts – and conversely, most data scientists and statisticians were not deep T-SQL and SQL Server experts.
Of the motivations to explore SQL Server R Services – improving performance of critical R-related operations was by far the biggest motivating factor, whereas the team-communication-gaps tended to be a second-order theme that we uncovered as we dug deeper into each customer’s scenario and requirements.
What results have customers seen so far?
A few customer experiences seen so far:
- Performance improvements with model generation and scoring against millions of rows. One customer was able to reproduce their modeling workflow functionality-results within SQL Server R Services and have it execute an attribution selection, segmentation and batch scoring process against a 20 million row table in under 1 hour of duration. Their original legacy methodology took more than two days for the equivalent process.
- Performance improvements for the generation of many small models. Another customer had a legacy product valuation process which was limited to ~ 200 valuations per hour. This scenario involved the generation of several models per product inventory item based on a small set of comparable inventory items across millions of products. After porting their ~ 700 lines of legacy R code to SQL Server R Services, they were able to scale to ~ 12,000 valuations per minute.
- Performance improvements using RevoScaleR functions. One customer saw performance improvements for linear regression operations using the RevoScaleR rxLinMod function against 10 million rows with 25 attributes, showing 3,500 seconds to generate the model in the legacy method via the open-source lm function vs. only 12 seconds using RevoScaleR’s rxLinMod and SQL Server R Services.
- Solution simplification. Performance wasn’t the only positive result. Customers have benefited from the ability to minimize code changes between the data scientist and database developer roles and also simplify and minimize the overall solution’s moving parts. We also saw benefits from having the two roles collaborate more closely together.
Common issues facing early adopters of SQL Server R Services
This next section will walk through some of the early lessons learned from early adopter customers.
Remembering the Simple Reality Check
One common scenario we saw with early adopter customers was as follows:
- The DBA team was in charge of installing SQL Server R Services. So they go through the instructions from Books Online (and sometimes may skip a step as people sometimes do) and then hand off the server to the data scientist and/or statistician.
- The data scientist tries using sp_execute_external_script or using pushed-compute context from their IDE-of-choice to the server and then immediate encounter an error message.
The recommendation in this case was to be sure to run a “reality check” test against the SQL Server instance in order to ensure SQL Server R Services is working properly. For example:
 EXECUTE   sp_execute_external_script
@language = N'R'
, @script = N'OutputDataSet <- InputDataSet'
, @input_data_1 = N'SELECT 1 as Col'
WITH RESULT SETS ((col int not null));
GO
This should return a result set with the value “1”. If instead an error is raised, one valuable troubleshooting resource is as follows:
Known Issues for SQL Server R Services (Books Online)
For more difficult issues, we also asked customers to provide the files from the Log\ExtensibilityLog error log directory for SQL Server R Services under the SQL Server instance error log directory (you can identify this path by executing SELECT SERVERPROPERTY('ErrorLogFileName')).
What packages are installed?
While SQL Server R Services comes out-of-the-box with R base packages and the RevoScaleR package, we found that most customers needed other packages installed in order to fully port their legacy code. So another common lesson learned was to determine what packages were installed for SQL Server R Services.
The following query shows a list of installed packages on the SQL Server instance:
 EXECUTE [sys].[sp_execute_external_script] @language = N'R',
@script = N'
packagematrix <- installed.packages();
NameOnly <- packagematrix[,1];
OutputDataSet <- as.data.frame(NameOnly);'
WITH RESULT SETS((PackageName NVARCHAR (250)));
Alternatively, a data scientist can use an R IDE to check which packages are installed on the SQL Server instance (using that instance for the compute context):
 con <- "Driver={SQL Server};Server= SQL1;Database=ContosoRetailDW;Trusted_Connection=true;"

sqlCompute <-
RxInSqlServer(
connectionString = con,
autoCleanup = TRUE,
numTasks = 8,
consoleOutput = TRUE
)
rxInstalledPackages(computeContext = sqlCompute)
Recommended reading on this topic:
Installing and Managing R Packages
Note: We found that some packages could be removed and de-referenced later in the overall testing process by replacing the originally-referenced functions with T-SQL or RevoScaleR equivalents.
Installing packages without Internet access
Most enterprise SQL Server instances will ideally not be exposed directly to the internet, so for package installation this involves downloading the package in the zipped format ahead of time and then copying the zipped files to a folder accessible on the SQL Server instance machine.
Additionally – packages often have dependencies on other packages, and so you must ensure you have the various packages and associated dependencies installed on the SQL Server instance machine. This can turn into a very time consuming and manual process – however there is a better solution documented here:
Create a Local Package Repository Using miniCRAN
This solution was developed by Microsoft Program Manager Andre de Vries, who developed the miniCRAN package. If you have more than a few packages to be installed, this solution can greatly speed up the process of preparing the SQL Server R Services environment.
Which package type to download?
A few early adopter customers encountered issues when they downloaded the “Package source” version of a package from https://cran.r-project.org/ instead of the Windows binary version. For example –they would install the tar.gz file instead of the .zip file. For some packages, this still worked and installation of the package was permitted, but for other packages, a cryptic error message would be raised.
The takeaway was as follows… To use a package with SQL Server R Services, download the zipped file in the Windows binary format.
R code verification; did it actually work before?
After early adopter customers installed SQL Server R Services and the required packages, the next step was to ensure functional parity between the legacy code and the code run within the context of SQL Server R Services. This was how we started the in-person SQL/R labs, by first ensuring that, given the same data set and R code, we output the same valid results.
This functionality testing led to early issues with some customers around syntax errors in the R code after migration to an sp_execute_external_script call. In some cases, the syntax errors were due to copy/paste issues or case-sensitivity problems. Other times however, we would end up troubleshooting code that had newly-introduced issues prior to encapsulation in sp_execute_external_script. So one of the common lessons and practices we asked customers to adopt was to have them test the code first in their IDE of choice (for example RStudio or R Tools for Visual Studio (RTVS)) prior to migration – before troubleshooting in the context of sp_execute_external_script.
Selecting an IDE
Most of our early adopter customers were already using RStudio, but some customers expressed interest in Microsoft options as well, and so we pointed them to R Tools for Visual Studio once it became available (RTVS). The overall recommendation was to do most R-code editing in their preferred IDE and then when ready, transfer the R script code to sp_execute_external_script. We received customer feedback along the way that it was tough to debug the code in its static form in sp_execute_external_script, and hence the recommendation to use an IDE first prior to migration.
Visualization options
While our early adopter customers were greatly interested in various advanced analytic algorithms in service of their business and application needs, they also were also still interested in using the powerful visualizations that R packages natively provide. That led to the following common questions around how best to render images from R within the context of SQL Server R Services.
For visualizations, there are a few options:
- Storing the image blob in SQL Server.
- BCP’ing out the blob to a file.
- Writing the file to a local file directory.
- Not storing the image, but instead just calling the stored procedure and rendering the image in real-time via SQL Server Reporting Services and Report Builder.
- Rendering via Power BI.
Furthermore, you can output both a data set and a scalar varbinary(max) value in a single call to sp_execute_external_script by using OUTPUT parameters.
See the following reference for examples on creating plots using R in T-SQL, returning and storing plots as a varbinary data type and BCP’ing out the file:
Explore and Visualize the Data (In-Database Advanced Analytics Tutorial)
The examples are part of an overall 6-step tutorial that covers an end-to-end In-Database SQL Server R Services scenario.
For another example, the following code creates a correlation plot across columns based on data from the FactInventory table, outputting the file to a temp directory:
 EXECUTE [sys].[sp_execute_external_script]
@language = N'R',
@script =
N'
library(corrplot)
corInput <- cor(InputDataSet)

mainDir <- ''C:\\Temp''
dir.create(mainDir, recursive = TRUE, showWarnings = FALSE)

print("Creating correlation plot file:", quote=FALSE)
dest_filename = tempfile(pattern = ''corrplot_'', tmpdir = mainDir)
dest_filename = paste(dest_filename, ''.png'',sep="")
print(dest_filename, quote=FALSE);

png(height=1000, width=1000, file=dest_filename)
corrplot(corInput, method = "pie")
dev.off();
',
@input_data_1 =
N'SELECT OnHandQuantity, StoreKey, ProductKey,
OnOrderQuantity, SafetyStockQuantity, DaysInStock,
MinDayInStock, MaxDayInStock, Aging, InventoryKey
FROM dbo.FactInventory TABLESAMPLE (10 PERCENT) REPEATABLE (2707)'
GO
This produces a graphical display of a correlation matrix across the columns of this table. Figure 1 shows a positive correlation between SafetyStockQuantity and OnHandQuantity and mild negative correlations between DaysInStock and the Aging table columns. The color and shading help indicate the correlation strength and direction – with deeper blues indicating a positive correlation and deeper reds showing a negative correlation:
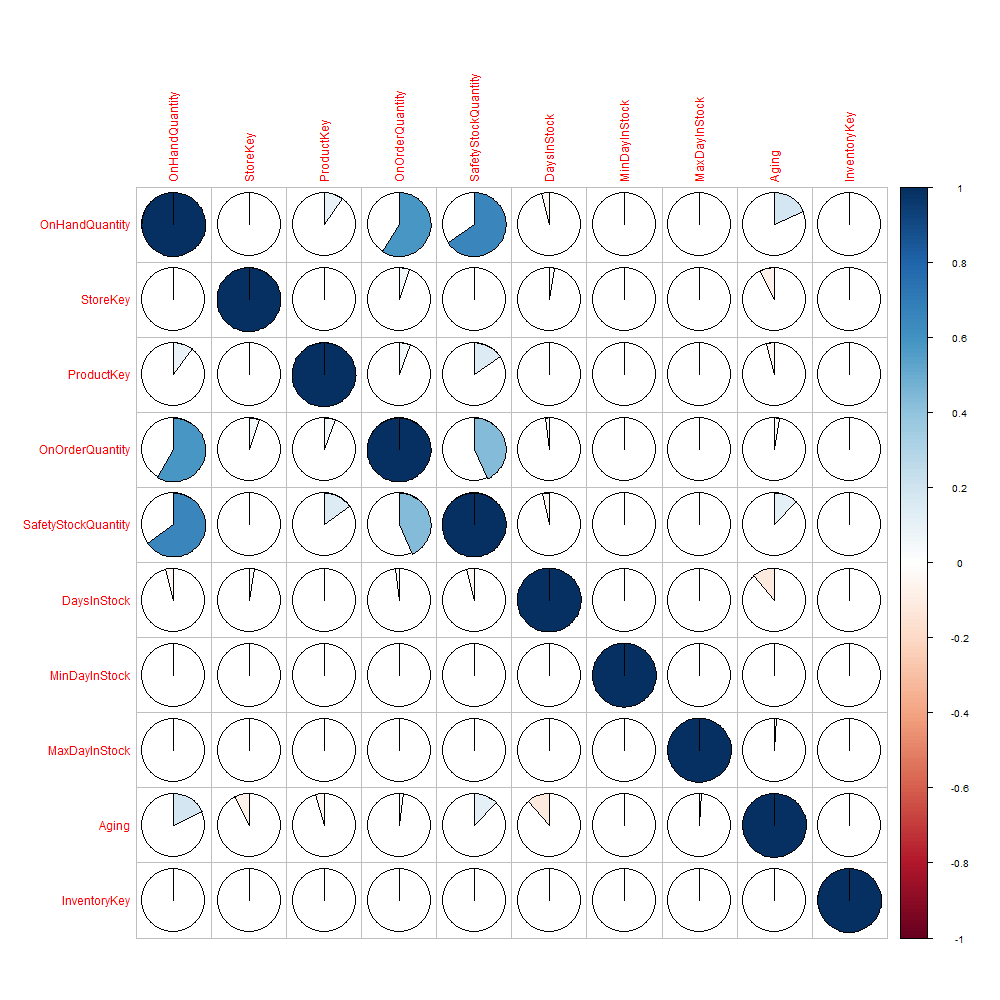
Figure 1
While data scientists are already accustomed to the rich graphical capabilities that R natively provides, we found that the database engineers will also benefit as well (for example – visualizing query execution characteristics across different compatibility levels for a fixed number of queries, as demonstrated via the ggplot package as follows):
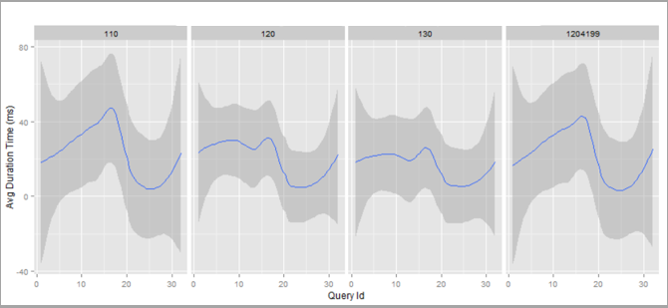
Figure 2
Figure 2 shows average duration by query, along with min/max ranges, across compatibility levels 110, 120, 130 and also 120 with trace flag 4199 enabled. In this particular scenario, we had Query Store data stored for a regression testing lab engagement and used qplot from the ggplot2 R package to generate the visualization, including using facet_grid(~ compatibility_level) to lay out panels in a grid.
There is a significant amount of untapped potential for DBAs here – and not just with visualizations but also the machine learning algorithms now surfaced via T-SQL (outlier detection in error logs, capacity planning for disk storage, clustering of workload characteristics and more).
We did receive requests to show R visualizations within SQL Server Management Studio natively, similar to geospatial data type output, although that wasn’t a feature that landed in RTM.
Performance optimizations
After working with customers to ensure the functionality seen in SQL Server R Services matches legacy methods, we then tested various methods for maximizing the performance and scalability of the new process.
Most early adopter customers were interested in answering the following questions:
- How do we scale our advanced analytic processes?
- How do we performance tune SQL Server R Services?
- Where are there optimization opportunities for T-SQL, R and RevoScaleR?
A few common themes arose from customer engagements:
- Separation of the model-and-scoring phases based on application requirements. For example – some customers only needed the model to be generated on a daily basis. Others even less frequently.
- Optimization of queries used for R-script ingestion.
- Modification of the Resource Governor external resource pool settings.
- Configuration of the batch size.
- Configuration of parallelism and the number of threads.
- Algorithm-based configurations – for example – varying the numbers of trees used for rxDForest and finding the right tradeoff between execution duration and model accuracy. For these cases, having a scientist available to determine what was “good enough” was critical.
- Porting to RevoScaleR equivalents (mentioned earlier in this blog post).
These subjects and more are covered in the following reference:
SQL Server R Services Performance Tuning (Books Online)
Be sure to review all three section topics (“SQL Server Configuration”, “R and Data Optimization”, and “Performance Case Study”).
Beyond the aforementioned performance tuning options, we saw a few string factor-related performance and validity tips based on work in the lab:
- For one customer scenario, the preference was to explicitly specify the levels for factors using the colInfo argument. When generating column info for the “colinfo” argument via rxCreateColInfo – we found that narrowing down the ingested SELECT list to only the attributes needed significantly reduced the duration (13 hours vs. 5 minutes in one test example).
- In terms of validity, we initially ran into scoring discrepancies between the legacy model generated and the model generated in SQL Server R Services when generating colInfo definition for RxSqlServerData. The solution was to ensure that sorting of levels was set to TRUE (colInfoDef <- rxCreateColInfo(data = attributeDataColInfo, sortLevels = TRUE) ). Otherwise, the default for sortLevels was FALSE.
Leveraging RevoScaleR
Early adopter customers saw significant performance gains for large data-set model generation and scoring activities when leveraging RevoScaleR implementations of some of common Open-R functions. When performing code reviews, we called out scenarios where existing Open-R functions had RevoScaleR equivalents.
The following summary shows rx functions and their nearest Open-R equivalents:
Summary of rx Functions (Books Online)
For example – the lm linear regression function and associated arguments map easily to the rxLinMod RevoScaleR function equivalent.
While there is a significant amount of coverage, not all functions have RevoScaleR equivalents. One customer wanted to use the rlm “Robust Fitting of Linear Models” function – which did not have a RevoScaleR equivalent. This didn’t block overall efforts however, since we still were able to use the rlm function in SQL Server R Services and saw significant performance gains due to localizing the data (removing the remote network pull of the data sets from the SQL Server instance to the data scientist application server).
Working with native strengths of both R and SQL Server
One consistent theme we pushed with customer engagements was ensuring that we optimize both from a R and a SQL Server perspective. There are some areas where SQL Server T-SQL will naturally excel and likewise, there will be areas where R makes most sense.
For example, the following query uses the R command “aggregate” to return total OnHandQuantity by ProductKey:
 EXEC sp_execute_external_script
@language = N'R'
, @script = N'
OutputDataSet <-
aggregate(InputDataSet$OnHandQuantity, by=list(ProductKey=InputDataSet$ProductKey), FUN=sum)'
, @input_data_1 = N'SELECT ProductKey, OnHandQuantity FROM dbo.FactInventory'
WITH RESULT SETS ((
[ProductKey] [INT] NOT NULL,
[SumOnHandQuantity] [INT] NOT NULL));
GO
On a laptop with 8 logical schedulers and 16GB of RAM, this query takes 13 seconds to execute.
Contrast this to the following T-SQL semantic equivalent which takes less than one second to execute:
 SELECT ProductKey, SUM(OnHandQuantity) AS SumOnHandQuantity
FROM dbo.FactInventory
GROUP BY ProductKey
ORDER BY ProductKey;
Conversely, coding a linear regression operation using T-SQL is unwieldy, verbose and inflexible compared to the R-equivalent. The following example uses rxLinMod to generate a model based on FactInventory sampled data and then returns the R-Squared value from the mode with just a few lines of code:
 EXECUTE [sys].[sp_execute_external_script]
@language = N'R',
@script =
N'
# model the relationship between a dependent variable
# and one or more explanatory variables
InventoryModel <- rxLinMod(OnHandQuantity ~ SafetyStockQuantity, InputDataSet)

# proportion of the variance in the dependent variable that is predictable from the independent variable
InventoryModelDetails <- InventoryModel$r.squared

OutputDataSet <- data.frame(InventoryModelDetails)',
@input_data_1 =
N'SELECT OnHandQuantity, SafetyStockQuantity
FROM dbo.FactInventory TABLESAMPLE (10 PERCENT) REPEATABLE (2707)'
WITH RESULT SETS ((
[r.squared] [FLOAT] NOT NULL));
GO
When porting to SQL Server R Services, we asked customers to take this as an opportunity to refactor code based on the strengths of both T-SQL and R. This doesn’t just include T-SQL re-writes, but also includes considerations around the queries used for R-script ingestion (for these queries, think about index opportunities, data compression, Columnstore indexes, and the universe of potential SQL Server optimization techniques).
Resource Governance and Monitoring
Hand-in-hand with performance and scalability, customers also had a natural interest in resource governance and how best to manage the collocation of SQL Server R Services workloads with other concurrent activities. For an overview, see the following Books Online reference:
Resource Governance for R Services (Books Online)
Customers also had questions regarding monitoring both the SQL Server and R-related operations. Details on this subject can be found here:
Be sure to review the sub-sections covering DMVs, Extended Events and using R Code Profiling functions. For our most recent SQLCAT lab, we used the RPROF function to help understand where the most time was spent on internal function calls (helping us optimize a lengthy R script where it was not immediately evident where the bottlenecks resided).
Customers also used standard perfmon counters for many of the performance tuning exercises, looking at CPU, memory, and I/O patterns both by SQL Server and also R related processes.
Security Considerations
Early adopter customers had several questions around the SQL Server R Services security model and some of these questions helped shape the following Books Online content:
Modify the User Account Pool for SQL Server R Services
Security Considerations for the R Runtime in SQL Server
One specific customer experience to call out… The least-privilege local accounts came as a surprise to one customer’s security team when they saw the twenty new local user accounts, named MSSQLSERVER01 through MSSQLSERVER20, created on the SQL Server machine. From a database engineer perspective, it is very important to review this topic and have a solid understanding of how the security model works so you can communicate what to expect with technical business partners.
Multiple inputs and outputs from sp_execute_external_script
The sp_execute_external_script procedure allows for a single input data set via the @input_data_1 argument, however it was common for customers to need more than one input data set for various purposes. For these scenarios, the following options are available:
- Use rxSQLServerData within the R-Script definition to define one or more data sources (see Create SQL Server Data Objects using RxSqlServerData for examples).
- Use RODBC within the R-Script definition to define one or more data sources.
- Define input parameters to sp_execute_external_script that contain JSON data. Then you can use a package like jsonlite to shred the data to individual data frames within the R-Script.
You can mix and match the aforementioned methods and even keep using @input_data_1 in conjunction with these inlined methods – although the general rule of thumb as recommended by the product team is to save @input_data_1 for your largest result set.
Note: For one customer lab, product engineering noticed that the RODBC package’s “sqlSave” function to save the results actually performs a one-row-at-a-time operation. To optimize for this particular scenario, we removed this code and instead returned the results of sp_execute_external_script as a result set within in a procedure. The customer then populated a table using an INSERT…EXEC operation instead.
What about the output of multiple result sets? This was another common customer request, and as of SQL Server 2016, you can choose to:
- Output nothing (just use the R script to perform various operations and then store results within SQL Server inline via the R script)
- Output a single result set
- Return a single result set along with one or more scalar output parameters.
You can also choose to store the result sets directly to SQL Server programmatically via the R-script definition and then retrieve them via separate procedure calls.
Tip of the Iceberg
This blog post just scratches the surface of the capabilities and tips for getting successfully started with SQL Server R Services. Now that the RTM version of SQL Server 2016 is generally available, we expect more feedback to start flowing in and also expect more themes and patterns to emerge.