Ask Learn
Preview
Please sign in to use this experience.
Sign inThis browser is no longer supported.
Upgrade to Microsoft Edge to take advantage of the latest features, security updates, and technical support.
Note
Access to this page requires authorization. You can try signing in or changing directories.
Access to this page requires authorization. You can try changing directories.
Reviewers: Dotan Elharrar, Sanjay Mishra, Mike Ruthruff, Umachandar Jayachandran, Jeannine Nelson-Takaki
SQLCAT and the SQL Server product team deeply engaged with many early adopter customers over the last year who were interested in actively testing SQL Server 2016 R Services across a variety of scenarios. These customers saw significant benefits from moving their legacy code to SQL Server R Services. This blog post provides a mosaic-view of the early adopter customer experiences along with common issues they faced and recommendations on how to avoid common pitfalls.
This blog post makes some assumptions around your familiarity with SQL Server R Services. If the topic is entirely new to you, we recommend the following resources in order to get familiar with the SQL Server R Services feature landscape:
In-database Advanced Analytics with R in SQL Server 2016: Basic overview of SQL Server R Services
Getting Started with SQL Server R Services: Books Online, core starting reference
Advanced Analytics with R and SQL: Video from Build conference
SQL Server R Services Tutorials: Books Online tutorials for both the data scientist and database developer audiences
Architecture Overview (SQL Server R Services)
For the architecture overview, be sure to review all three sub-topics – including “R Interoperability in SQL Server R Services”, “New Components in SQL Server to Support R Services”, and the “Security Overview”.
Early adopter customer industries varied significantly and included energy, investments, credit, health care, real estate, accounting and audit software. Specific scenarios included:
Several customers had existing R solutions already in-use, although there was one customer who had their existing linear regression solution implemented via SSAS \ Data Mining Models and SQL Server, and wanted to consolidate down to a single solution using SQL Server R Services.
The motivations behind early adopters exploring SQL Server R Services clustered around the following themes:
Of the motivations to explore SQL Server R Services – improving performance of critical R-related operations was by far the biggest motivating factor, whereas the team-communication-gaps tended to be a second-order theme that we uncovered as we dug deeper into each customer’s scenario and requirements.
A few customer experiences seen so far:
This next section will walk through some of the early lessons learned from early adopter customers.
One common scenario we saw with early adopter customers was as follows:
The recommendation in this case was to be sure to run a “reality check” test against the SQL Server instance in order to ensure SQL Server R Services is working properly. For example:
 EXECUTE   sp_execute_external_script
@language = N'R'
, @script = N'OutputDataSet <- InputDataSet'
, @input_data_1 = N'SELECT 1 as Col'
WITH RESULT SETS ((col int not null));
GO
This should return a result set with the value “1”. If instead an error is raised, one valuable troubleshooting resource is as follows:
Known Issues for SQL Server R Services (Books Online)
For more difficult issues, we also asked customers to provide the files from the Log\ExtensibilityLog error log directory for SQL Server R Services under the SQL Server instance error log directory (you can identify this path by executing SELECT SERVERPROPERTY('ErrorLogFileName')).
While SQL Server R Services comes out-of-the-box with R base packages and the RevoScaleR package, we found that most customers needed other packages installed in order to fully port their legacy code. So another common lesson learned was to determine what packages were installed for SQL Server R Services.
The following query shows a list of installed packages on the SQL Server instance:
 EXECUTE [sys].[sp_execute_external_script] @language = N'R',
@script = N'
packagematrix <- installed.packages();
NameOnly <- packagematrix[,1];
OutputDataSet <- as.data.frame(NameOnly);'
WITH RESULT SETS((PackageName NVARCHAR (250)));
Alternatively, a data scientist can use an R IDE to check which packages are installed on the SQL Server instance (using that instance for the compute context):
 con <- "Driver={SQL Server};Server= SQL1;Database=ContosoRetailDW;Trusted_Connection=true;"

sqlCompute <-
RxInSqlServer(
connectionString = con,
autoCleanup = TRUE,
numTasks = 8,
consoleOutput = TRUE
)
rxInstalledPackages(computeContext = sqlCompute)
Recommended reading on this topic:
Installing and Managing R Packages
Note: We found that some packages could be removed and de-referenced later in the overall testing process by replacing the originally-referenced functions with T-SQL or RevoScaleR equivalents.
Most enterprise SQL Server instances will ideally not be exposed directly to the internet, so for package installation this involves downloading the package in the zipped format ahead of time and then copying the zipped files to a folder accessible on the SQL Server instance machine.
Additionally – packages often have dependencies on other packages, and so you must ensure you have the various packages and associated dependencies installed on the SQL Server instance machine. This can turn into a very time consuming and manual process – however there is a better solution documented here:
Create a Local Package Repository Using miniCRAN
This solution was developed by Microsoft Program Manager Andre de Vries, who developed the miniCRAN package. If you have more than a few packages to be installed, this solution can greatly speed up the process of preparing the SQL Server R Services environment.
A few early adopter customers encountered issues when they downloaded the “Package source” version of a package from https://cran.r-project.org/ instead of the Windows binary version. For example –they would install the tar.gz file instead of the .zip file. For some packages, this still worked and installation of the package was permitted, but for other packages, a cryptic error message would be raised.
The takeaway was as follows… To use a package with SQL Server R Services, download the zipped file in the Windows binary format.
After early adopter customers installed SQL Server R Services and the required packages, the next step was to ensure functional parity between the legacy code and the code run within the context of SQL Server R Services. This was how we started the in-person SQL/R labs, by first ensuring that, given the same data set and R code, we output the same valid results.
This functionality testing led to early issues with some customers around syntax errors in the R code after migration to an sp_execute_external_script call. In some cases, the syntax errors were due to copy/paste issues or case-sensitivity problems. Other times however, we would end up troubleshooting code that had newly-introduced issues prior to encapsulation in sp_execute_external_script. So one of the common lessons and practices we asked customers to adopt was to have them test the code first in their IDE of choice (for example RStudio or R Tools for Visual Studio (RTVS)) prior to migration – before troubleshooting in the context of sp_execute_external_script.
Most of our early adopter customers were already using RStudio, but some customers expressed interest in Microsoft options as well, and so we pointed them to R Tools for Visual Studio once it became available (RTVS). The overall recommendation was to do most R-code editing in their preferred IDE and then when ready, transfer the R script code to sp_execute_external_script. We received customer feedback along the way that it was tough to debug the code in its static form in sp_execute_external_script, and hence the recommendation to use an IDE first prior to migration.
While our early adopter customers were greatly interested in various advanced analytic algorithms in service of their business and application needs, they also were also still interested in using the powerful visualizations that R packages natively provide. That led to the following common questions around how best to render images from R within the context of SQL Server R Services.
For visualizations, there are a few options:
Furthermore, you can output both a data set and a scalar varbinary(max) value in a single call to sp_execute_external_script by using OUTPUT parameters.
See the following reference for examples on creating plots using R in T-SQL, returning and storing plots as a varbinary data type and BCP’ing out the file:
Explore and Visualize the Data (In-Database Advanced Analytics Tutorial)
The examples are part of an overall 6-step tutorial that covers an end-to-end In-Database SQL Server R Services scenario.
For another example, the following code creates a correlation plot across columns based on data from the FactInventory table, outputting the file to a temp directory:
 EXECUTE [sys].[sp_execute_external_script]
@language = N'R',
@script =
N'
library(corrplot)
corInput <- cor(InputDataSet)

mainDir <- ''C:\\Temp''
dir.create(mainDir, recursive = TRUE, showWarnings = FALSE)

print("Creating correlation plot file:", quote=FALSE)
dest_filename = tempfile(pattern = ''corrplot_'', tmpdir = mainDir)
dest_filename = paste(dest_filename, ''.png'',sep="")
print(dest_filename, quote=FALSE);

png(height=1000, width=1000, file=dest_filename)
corrplot(corInput, method = "pie")
dev.off();
',
@input_data_1 =
N'SELECT OnHandQuantity, StoreKey, ProductKey,
OnOrderQuantity, SafetyStockQuantity, DaysInStock,
MinDayInStock, MaxDayInStock, Aging, InventoryKey
FROM dbo.FactInventory TABLESAMPLE (10 PERCENT) REPEATABLE (2707)'
GO
This produces a graphical display of a correlation matrix across the columns of this table. Figure 1 shows a positive correlation between SafetyStockQuantity and OnHandQuantity and mild negative correlations between DaysInStock and the Aging table columns. The color and shading help indicate the correlation strength and direction – with deeper blues indicating a positive correlation and deeper reds showing a negative correlation:
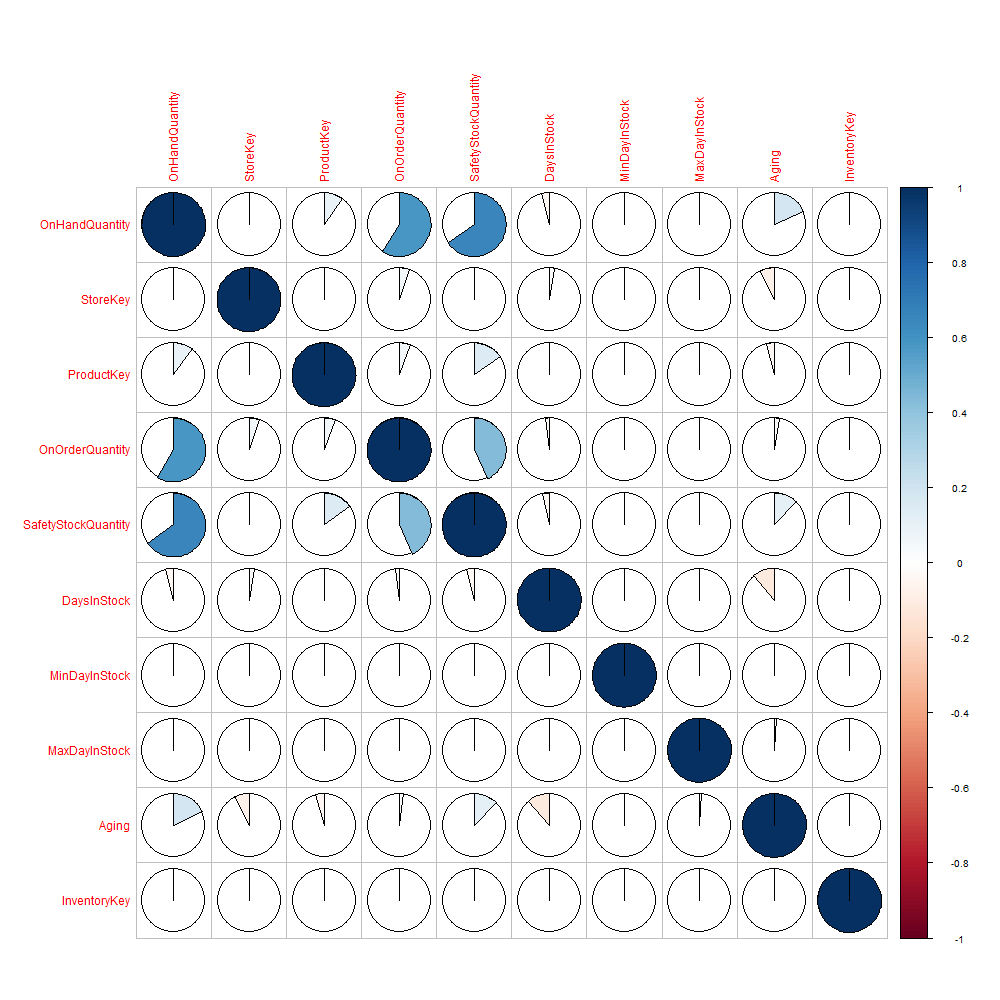
Figure 1
While data scientists are already accustomed to the rich graphical capabilities that R natively provides, we found that the database engineers will also benefit as well (for example – visualizing query execution characteristics across different compatibility levels for a fixed number of queries, as demonstrated via the ggplot package as follows):
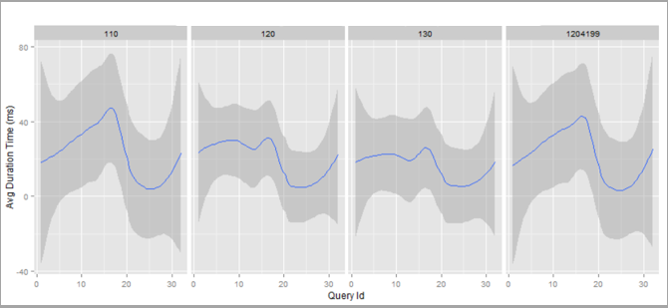
Figure 2
Figure 2 shows average duration by query, along with min/max ranges, across compatibility levels 110, 120, 130 and also 120 with trace flag 4199 enabled. In this particular scenario, we had Query Store data stored for a regression testing lab engagement and used qplot from the ggplot2 R package to generate the visualization, including using facet_grid(~ compatibility_level) to lay out panels in a grid.
There is a significant amount of untapped potential for DBAs here – and not just with visualizations but also the machine learning algorithms now surfaced via T-SQL (outlier detection in error logs, capacity planning for disk storage, clustering of workload characteristics and more).
We did receive requests to show R visualizations within SQL Server Management Studio natively, similar to geospatial data type output, although that wasn’t a feature that landed in RTM.
After working with customers to ensure the functionality seen in SQL Server R Services matches legacy methods, we then tested various methods for maximizing the performance and scalability of the new process.
Most early adopter customers were interested in answering the following questions:
A few common themes arose from customer engagements:
These subjects and more are covered in the following reference:
SQL Server R Services Performance Tuning (Books Online)
Be sure to review all three section topics (“SQL Server Configuration”, “R and Data Optimization”, and “Performance Case Study”).
Beyond the aforementioned performance tuning options, we saw a few string factor-related performance and validity tips based on work in the lab:
Early adopter customers saw significant performance gains for large data-set model generation and scoring activities when leveraging RevoScaleR implementations of some of common Open-R functions. When performing code reviews, we called out scenarios where existing Open-R functions had RevoScaleR equivalents.
The following summary shows rx functions and their nearest Open-R equivalents:
Summary of rx Functions (Books Online)
For example – the lm linear regression function and associated arguments map easily to the rxLinMod RevoScaleR function equivalent.
While there is a significant amount of coverage, not all functions have RevoScaleR equivalents. One customer wanted to use the rlm “Robust Fitting of Linear Models” function – which did not have a RevoScaleR equivalent. This didn’t block overall efforts however, since we still were able to use the rlm function in SQL Server R Services and saw significant performance gains due to localizing the data (removing the remote network pull of the data sets from the SQL Server instance to the data scientist application server).
One consistent theme we pushed with customer engagements was ensuring that we optimize both from a R and a SQL Server perspective. There are some areas where SQL Server T-SQL will naturally excel and likewise, there will be areas where R makes most sense.
For example, the following query uses the R command “aggregate” to return total OnHandQuantity by ProductKey:
 EXEC sp_execute_external_script
@language = N'R'
, @script = N'
OutputDataSet <-
aggregate(InputDataSet$OnHandQuantity, by=list(ProductKey=InputDataSet$ProductKey), FUN=sum)'
, @input_data_1 = N'SELECT ProductKey, OnHandQuantity FROM dbo.FactInventory'
WITH RESULT SETS ((
[ProductKey] [INT] NOT NULL,
[SumOnHandQuantity] [INT] NOT NULL));
GO
On a laptop with 8 logical schedulers and 16GB of RAM, this query takes 13 seconds to execute.
Contrast this to the following T-SQL semantic equivalent which takes less than one second to execute:
 SELECT ProductKey, SUM(OnHandQuantity) AS SumOnHandQuantity
FROM dbo.FactInventory
GROUP BY ProductKey
ORDER BY ProductKey;
Conversely, coding a linear regression operation using T-SQL is unwieldy, verbose and inflexible compared to the R-equivalent. The following example uses rxLinMod to generate a model based on FactInventory sampled data and then returns the R-Squared value from the mode with just a few lines of code:
 EXECUTE [sys].[sp_execute_external_script]
@language = N'R',
@script =
N'
# model the relationship between a dependent variable
# and one or more explanatory variables
InventoryModel <- rxLinMod(OnHandQuantity ~ SafetyStockQuantity, InputDataSet)

# proportion of the variance in the dependent variable that is predictable from the independent variable
InventoryModelDetails <- InventoryModel$r.squared

OutputDataSet <- data.frame(InventoryModelDetails)',
@input_data_1 =
N'SELECT OnHandQuantity, SafetyStockQuantity
FROM dbo.FactInventory TABLESAMPLE (10 PERCENT) REPEATABLE (2707)'
WITH RESULT SETS ((
[r.squared] [FLOAT] NOT NULL));
GO
When porting to SQL Server R Services, we asked customers to take this as an opportunity to refactor code based on the strengths of both T-SQL and R. This doesn’t just include T-SQL re-writes, but also includes considerations around the queries used for R-script ingestion (for these queries, think about index opportunities, data compression, Columnstore indexes, and the universe of potential SQL Server optimization techniques).
Hand-in-hand with performance and scalability, customers also had a natural interest in resource governance and how best to manage the collocation of SQL Server R Services workloads with other concurrent activities. For an overview, see the following Books Online reference:
Resource Governance for R Services (Books Online)
Customers also had questions regarding monitoring both the SQL Server and R-related operations. Details on this subject can be found here:
Be sure to review the sub-sections covering DMVs, Extended Events and using R Code Profiling functions. For our most recent SQLCAT lab, we used the RPROF function to help understand where the most time was spent on internal function calls (helping us optimize a lengthy R script where it was not immediately evident where the bottlenecks resided).
Customers also used standard perfmon counters for many of the performance tuning exercises, looking at CPU, memory, and I/O patterns both by SQL Server and also R related processes.
Early adopter customers had several questions around the SQL Server R Services security model and some of these questions helped shape the following Books Online content:
Modify the User Account Pool for SQL Server R Services
Security Considerations for the R Runtime in SQL Server
One specific customer experience to call out… The least-privilege local accounts came as a surprise to one customer’s security team when they saw the twenty new local user accounts, named MSSQLSERVER01 through MSSQLSERVER20, created on the SQL Server machine. From a database engineer perspective, it is very important to review this topic and have a solid understanding of how the security model works so you can communicate what to expect with technical business partners.
The sp_execute_external_script procedure allows for a single input data set via the @input_data_1 argument, however it was common for customers to need more than one input data set for various purposes. For these scenarios, the following options are available:
You can mix and match the aforementioned methods and even keep using @input_data_1 in conjunction with these inlined methods – although the general rule of thumb as recommended by the product team is to save @input_data_1 for your largest result set.
Note: For one customer lab, product engineering noticed that the RODBC package’s “sqlSave” function to save the results actually performs a one-row-at-a-time operation. To optimize for this particular scenario, we removed this code and instead returned the results of sp_execute_external_script as a result set within in a procedure. The customer then populated a table using an INSERT…EXEC operation instead.
What about the output of multiple result sets? This was another common customer request, and as of SQL Server 2016, you can choose to:
You can also choose to store the result sets directly to SQL Server programmatically via the R-script definition and then retrieve them via separate procedure calls.
This blog post just scratches the surface of the capabilities and tips for getting successfully started with SQL Server R Services. Now that the RTM version of SQL Server 2016 is generally available, we expect more feedback to start flowing in and also expect more themes and patterns to emerge.
Please sign in to use this experience.
Sign in