Diagnosing Transaction Log Performance Issues and Limits of the Log Manager
As of September 1, 2013 we decided to remove SQLCAT.COM site and use MSDN as the primary vehicle to post new SQL Server content. This was done to minimize reader confusion and to streamline content publication. MSDN SQLCAT blogs already includes most SQLCAT.COM Content and will continue to be updated with more SQLCAT learnings.
To make the transition to MSDN smoother, we are in the process of reposting a few of SQLCAT.COM’s blogs that are still being very actively viewed. Following is reposting of one of the SQLCAT.Com blogs that still draws huge interest.
Also, Follow us on Twitter as we normally use our Twitter handles @MSSQLCAT and @MSAzureCAT to announce new news.
Thank you for your interest.
Overview
For transactional workloads I/O performance of the writes to the SQL Server transaction log is critical to both throughput and application response time. This document discusses briefly how to determine if I/O to the transaction log file is a performance bottleneck and how to determine if this is storage related; a limitation is due to log manager itself or a combination of the two. Concepts and topics described in this paper apply mainly to SQL Server 2005 and SQL Server 2008.
Monitoring Transaction Log Performance
To determine if I/O performance of transaction log writes is a problem there are several tools which can help quickly isolate bottlenecks related to the log writes. These are:
1. SQL Server Dynamic Management Views (DMV’s).
a. sys.dm_os_wait_stats: This DMV exposes a number of wait types documented
here. The wait type most relevant the current discussion is WRITELOG. WRITELOG waits represent the time waiting on a log I/O to complete after a COMMIT has been issued by the transaction. When observed these should be an indication I/O performance and characteristics of the log writes should be pursued.
b. sys.dm_io_pending_io_requests: This DMV exposes outstanding I/O requests at the individual I/O level. Documentation for this DMV can be found
here. In scenarios where the SQL Server transaction log file is not on a dedicated volume this DMV can be used to track the number of outstanding I/O’s at the file level. If the transaction log is on a dedicated logical volume this information can be obtained using Performance Monitor counters. More details on both are given below.
2. Window Performance Monitor "SQL Server:Databases" Object
This performance monitor object contains several counters specific to performance of a transaction log for a specific database. In many cases these can provide more detailed information about log performance as the granularity is at the log level regardless of the logical storage configuration. The specific counters are:
a. Log Bytes Flushed/sec
b. Log Flushes/sec - (i.e. I/O operation to flush a log record to the transaction log)
c. Log Flush Wait Time
3. Windows Performance Monitor "Logical or Physical Disk" Objects.
There are five counters that should be considered in any I/O analysis:
a. Current Disk Queue Length
b. Avg. Disk/sec Read, Avg. Disk/Write
c. Avg. Disk Bytes/Read, Avg. Disk Bytes/Write
d. Disk Reads/sec, Disk Writes/sec
e. Disk Read Bytes/sec, Disk Write Bytes/sec
The key counters to monitor with respect to log performance are the Current Disk Queue Length and Avg. Disk/sec Write.
These are the primary tools which are used to monitor I/O performance of the transaction log and diagnose any bottlenecks related to transaction log throughput. When troubleshooting any performance issue it is critical to look first at the complete overall system performance before focusing on any individual item. For the purpose of this discussion we will focus on diagnosing transaction log performance.
How Do I Determine if I Have a Log Bottleneck?
The quickest way to determine if you think performance issues are related to transaction log performance is to monitor sys.dm_os_wait_stats for high waits on WRITELOG. It is important to understand that this counter is cumulative since SQL Server was last restarted so monitoring deltas of these values over specific time periods is necessary to provide meaningful details.
There are two primary questions to answer when investigating a performance issue which is suspected to be log related.
1. Is the performance of the I/O subsystem adequate to provide healthy response times to I/O issued against the log?
2. Am I hitting any limits imposed by SQL Server related to transaction log behavior?
In the majority of experiences observed related to I/O performance issues, improperly sized or poorly configured storage is the primary contributor to I/O issues. This can be made worse by queries which are not tuned and issue more I/O than necessary affecting everyone using the I/O subsystem. In addition, there are other factors that will have some impact on log including things such as transactional replication, log backups, mirroring, storage level replication etc...
With respect to #1 our recommendation for response time on the log device should be in the range of <1ms to 5ms. It is important to keep I/O response time on log devices as low as possible which is the primary reason we recommend isolating logs from data files on separate physical spindles. Writes to the transaction log are sequential in nature and benefit by being isolated on to separate physical devices. In today’s modern storage environments there are many considerations which may make this impractical so in the absence of the ability to do this focus on keeping response times in the healthy range.
Limits of the Log Manager
Within the SQL Server engine there are a couple limits related to the amount of I/O that can be "in-flight" at any given time; "in-flight" meaning log data for which the Log Manager has issued a write and not yet received an acknowledgement that the write has completed. Once these limits are reached the Log Manager will wait for outstanding I/O’s to be acknowledged before issuing any more I/O to the log. These are hard limits and cannot be adjusted by a DBA. The limits imposed by the log manager are based on conscious design decisions founded in providing a balance between data integrity and performance.
There are two specific limits, both of which are per database.
1. Amount of "outstanding log I/O" Limit.
a. SQL Server 2008: limit of 3840K at any given time
b. Prior to SQL Server 2008: limit of 480K at any given time
c. Prior to SQL Server 2005 SP1: based on the number of outstanding requests (noted below)
2. Amount of Outstanding I/O limit.
a. SQL Server 2005 SP1 or later (including SQL Server 2008 ):
i. 64-bit: Limit of 32 outstanding I/O’s
ii. 32-bit: Limit of 8 outstanding I/O’s
b. Prior to SQL Server 2005 SP1: Limit of 8 outstanding I/O’s (32-bit or 64-bit)
Either of the above limits being reached will cause the suspension of the Log I/O until acknowledgments are received. Below are two examples which illustrate the above and provide guidance on how to determine how isolate whether or not these limits are being reached.
Example 1
This example illustrates the limit of 32 outstanding I/O’s on the 64-bit edition of SQL Server 2008. The Current Disk Queue Length counter is represented by the black line in the graph. The workload was executing approximately 14,000 inserts per second with each insert being a single transaction. The workload was generated using a multi-threaded client. The disk response time in this example is averaging 2ms. High wait times on WRITELOG were observed as this workload throughput level was approached suggesting investigation of disk throughput on the log device. This led us to investigate if the 32 outstanding I/O limit was the cause.
In Figure 1 below we can see the limit of 32 outstanding I/O’s clearly being reached. We can also determine it is the limit of outstanding I/O’s vs. the limit of 480K "outstanding log I/O" based on the following calculations (averages over this period of time as observed via Performance Monitor).
· (9.6MB Log Bytes Flushed/sec)/(5000 Log Flushes/sec) = ~1.9K per Flush
· (32 Outstanding I/O’s)*(1.9K per Flush) = ~60K "in-flight" at any given time (far below the limit)
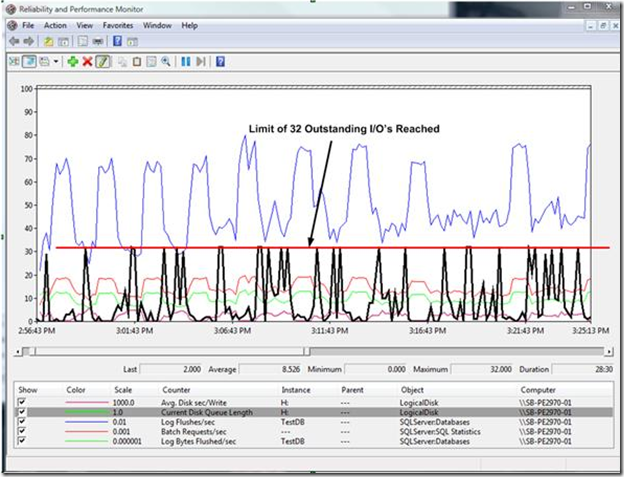
Figure 1: Performance Monitor graph illustrating the limit of 32 outstanding I/O’s
In this particular scenario the Current Disk Queue Length could be utilized to diagnose the bottleneck because the log resided on its own logical volume (in this case H:\) . As discussed above, if the log did not reside on a dedicated logical volume, an alternative approach to diagnosing the limit being encountered would have been to use the sys.dm_io_pending_io_requests DMV discussed previously.
The following is a sample query that could be used to monitor a particular log file. This query needs to be run in the context of the database being monitored. It is worth noting that the results returned by this query are transient in nature and polling at short intervals would likely be needed for the data to be useful much in the same way performance monitor samples the disk queue.
select vfs.database_id, df.name, df.physical_name
,vfs.file_id, ior.io_pending
,ior.io_handle, vfs.file_handle
from sys.dm_io_pending_io_requests ior
inner join sys.dm_io_virtual_file_stats (DB_ID(), NULL) vfs on (vfs.file_handle = ior.io_handle)
inner join sys.database_files df on (df.file_id = vfs.file_id)
where df.name = '[Logical Log File Name]'
For this example, the best strategy to resolve or optimize the transaction log performance would be to isolate the transaction log file on a storage device which was not impacted by the checkpoint operations. In our storage configuration this was not possible and shared components (specifically array controllers) were the primary source of the problem.
Example 2
This example is a little more complicated but illustrates the limit of 480K "in-flight" data running SQL Server 2005 SP2 (64-bit edition). This was observed during a benchmark of a high throughput OLTP application supporting approximately 15,000 concurrent users. Characteristics of this application were a bit different in that the log flush sizes were much larger due to logging of larger transactions (including BLOB data). Again, high waits on the WRITELOG wait type were observed pointing in the direction of investigating I/O performance of the log device.
One important item to note when considering this data is that the log behavior over this period of time is spiky in nature and it is during the spikes the limits are encountered. If we look at averages over the problem time period we see the following
· (4,858,000 Log Bytes Flushed/sec)/(124 Log Flushes/sec) = 39,177 bytes per flush
· 5.4 ms per log flush but there are spikes. This is on the edge of health latency for the log.
· Current Disk Queue Length shows spikes and when Current Disk Queue Length * Bytes per flush is close to 480KB then we will start to see the Log Manager throttle the writes (observed as higher wait times on WRITELOG).
Figure 2 illustrates this although it is not as obvious to see as the pervious example. The correlation to watch for is (Average Bytes per Flush) * (Current Disk Queue Length) near the 480K limit.
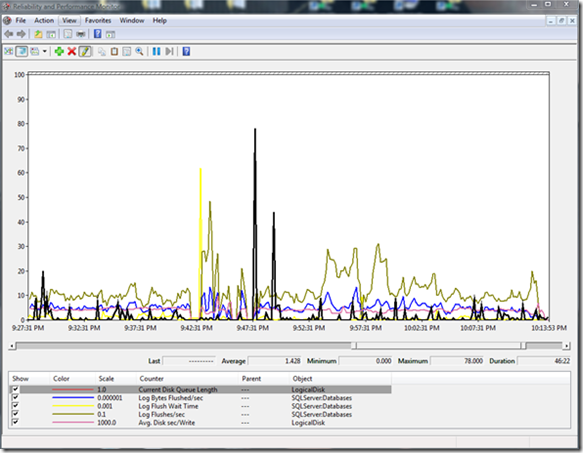
Figure 2: Performance Monitor graph illustrating the limit of 480K outstanding log I/O data
A strategy for resolving this problem would be to work on the storage configuration to bring the latency on the log writes to a lower average. In this particular scenario, log latency was impacted by the fact that synchronous storage replication was occurring at the block level from the primary storage array to a second array. Disabling storage level replication reduces the log latency from the 5ms range to the range of <1ms however disaster recovery requirements for zero data loss made this not an option for the production environment.
It is worth noting that this was observed on SQL Server 2005 SP2 and migrating to SQL Server 2008 resolved the bottleneck since the limit in SQL 2008 is 8 times that of SQL Server 2005.
In either example reducing log latency is critical to increasing the transactional throughput. In very high throughput scenarios at the extreme end we have observed customers approaching this by alternative methods including 1) utilizing minimal logging capabilities of SQL Server when possible and 2) scaling out the transaction log through partitioning data into multiple databases.
Summary
The above provides information on limits imposed by the SQL Server Log Manager. These limits are based on conscious design decisions founded in providing a balance between data integrity and performance. When troubleshooting performance issues related to log performance, always consider optimizing the storage configuration to provide the best response time possible to the log device. This is critical to transactional performance in OLTP workloads.