Concurrency Series: My application was running fine yesterday but why is it blocking today?
Author: Sunil Agarwal
Reviewers: Kun Cheng, Chuck Heinzelman, Shaun Tinline-Jones, Sanjay Mishra, And Kevin Liu
Have you ever encountered a situation where a query was running fine yesterday but today it is running a lot slower? I am sure most of us have seen a situation like that which can be quite frustrating. While there can be many reasons but there are two common cases as described below:
· First is that the query plan might have changed due to stale statistics, or missing indexes (accidental drop of an index) or by passing an uncommon parameter value leading to an inefficient query plan for other parameter values.
· Second is due to blocking. In this blog, I will focus on the blocking that is caused specifically by lock escalation.
Before we proceed further, I would like point out that the best way to troubleshoot performance problems is to have a baseline of your workload when it was running with acceptable performance. You can then use the baseline compare it with current situation to get clues of what could be going wrong. I will recommend that you read the white paper to get an idea about general methodology https://msdn.microsoft.com/en-us/library/dd672789(SQL.100).aspx
Now, let us go back to the problem. In SQL Server, a lock can be taken at a row, page, or table level but there is a trade-off. If the lock is taken at a lower granularity say at ROW level, it will lead to more concurrency at the expense of higher number of locks. Similarly, if the lock is taken at a higher granularity say at TABLE level, it will lead to lower concurrency but at much reduced overhead of locks. To take an extreme example, if you have a table with 10 million rows and you need to read 10% of the rows at ‘repeatable read’ isolation level, the SQL Server, assuming it chose ROW locking granularity, will need to acquire 1 million locks, hold them in memory (approx. 100 MB storage) and then release 1 million locks at the end of the transaction. This is a significant overhead compared to 1 lock to be taken at table level with TABLE locking granularity. SQL Server uses an internal heuristic to choose the locking granularity when executing a SQL statement. You can override this locking granularity using Alter Index statement to control (ALLOW_PAGE_LOCKS or ALLOW_ROW_LOCKS). Additionally, SQL Server uses the lock escalation mechanism to promote the lock from lower granularity to TABLE level using an internal threshold. Please refer to https://blogs.msdn.com/b/sqlserverstorageengine/archive/2006/05/17/lock-escalation.aspx for details. Starting with SQL Server 2008, you can also optionally disable lock escalation at TABLE level.
Let us look at some example to understand lock escalation behavior.
-- create the table
create table t_escalation (c1 int, c2 int)
go
-- create a clustered index.
create clustered index ci_t_escalation on t_escalation (c1)
go
-- insert 10000 rows into the table. Note, there will NOT be any lock -- escalation in this case even though we are inserting 10000 rows as -- part of single transaction. The lock escalation threshold in SQL
-- Server is defined at a statement level rather than at transaction
-- level
begin tran
declare @i int = 0
while (@i < 10000)
begin
insert into t_escalation values (@i, @i)
set @i = @i + 1
end
commit
The table t_escalation has 10000 rows. Let us update all rows in a single UPDATE statement. In this case, we will expect the lock escalation to occur as we are modifying > 5000 rows and there are not a concurrent transaction accessing the table t_escalation to prevent it.
-- Update all 10000 rows
declare @escalation_counter_before_test bigint;
select @escalation_counter_before_test=cntr_value
from sys.dm_os_performance_counters
where counter_name = 'Table Lock Escalations/sec'
begin tran
update t_escalation set c2 = c2 + 1
declare @escalation_counter_after_test bigint;
select @escalation_counter_after_test=cntr_value
from sys.dm_os_performance_counters
where counter_name = 'Table Lock Escalations/sec';
-- check to see if the lock escalation has occured
print 'lock escalation count ' +
convert( varchar(100), @escalation_counter_after_test-
@escalation_counter_before_test);
-- commit the transaction
commit
Here is the output of running the batch above. As expected, we got the lock escalation.
(10000 row(s) affected)
lock escalation count 1
Now, let us consider a variation of this example where instead of updating all the rows in the table, we only update the rows that qualify the predicate (C1 < 4000). Since 4000 rows is less than the threshold of 5000 rows, there will be no lock escalation.
-- update only 4000 rows. In this case, the SQL Server
-- chose ROW locking granularity.
begin tran
update t_escalation set c2 = c2 + 1 where c1 < 4000
Concurrently, we run the following query in a different session.
-- Session-2: Select a row that was not a target of
-- update in session-1.
select * from t_escalation where c1 = 5000
You will note that this SELECT runs without blocking because the query plan for this query shows it is using the index scan as follows

We now commit the transaction in session-1
-- commit the transaction
Commit
Next step is to insert another 3000 rows in between the range (1 to 4000) as follows
declare @i int = 0
while (@i < 3000)
begin
insert into t_escalation values (@i, @i)
set @i = @i + 1
end
If we run the same update command again in session-1, you will notice that this time, the lock indeed got escalated because the number of rows updated from 4000 to 7000 causing it to cross the lock escalation threshold.
-------------------------------------------------------
-- Show the the last update causes lock to get
-- escalated.
------------------------------------------------------
declare @escalation_counter_before_test bigint;
select @escalation_counter_before_test=cntr_value
from sys.dm_os_performance_counters
where counter_name = 'Table Lock Escalations/sec'
begin tran
update t_escalation set c2 = c2 + 1 where c1 < 4000
declare @escalation_counter_after_test bigint;
select @escalation_counter_after_test=cntr_value
from sys.dm_os_performance_counters
where counter_name = 'Table Lock Escalations/sec';
print 'lock escalation count ' +
convert( varchar(100),
@escalation_counter_after_test -
@escalation_counter_before_test);
-- Here is the output
(7000 row(s) affected)
lock escalation count 1
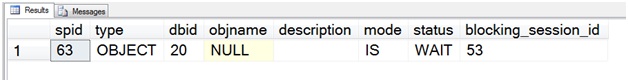
Now in session-2, if we run the same SELECT, it will get blocked because the locks taken by session-1 have been escalated to table level. This is one example where a query that was running without blocking yesterday but has suddenly started seeing blocking.
-- Session-2: Run the SELECT query
select * from t_escalation where c1 = 5000
Solution: You can choose to disable lock escalation using the following command
-- disable lock escalation to remove the blocking
alter table t_escalation set (lock_escalation=DISABLE)
Thanks
Sunil Agarwal