Is my query running fine in the cloud?
This is the fifth installment in a blog series. The previous entry is located here
We ended the last blog post with some tips on basic administration that you need to do in WASD. Now let us get more specific with regards to query tuning and what tool are available to help you in this area.
Although WASD is a smaller feature set from the on premise SQL Server, it has a set of DMVs that allow you to get insight into your workload and do some basic troubleshooting of issues that you see with query performance. Here is listing of some of the common ones that I use frequently.
Query Performance related DMVs
The challenge here is figuring out whether your queries are running or waiting. If they are waiting, then is there a common wait_type that we can go tune.
Sys.dm_exec_requests, Sys.dm_exec_sessions
These two DMVs combined can give you a lot of useful information.
select
r.session_id,r.blocking_session_id,r.wait_type,r.wait_time,r.wait_resource,r.total_elapsed_time,r.cpu_time,r.reads,r.writes,
s.nt_user_name,s.program_name,s.total_elapsed_time
from
sys.dm_exec_requests
r
join
sys.dm_exec_sessions
s
on
s.session_id=r.session_id
The typical columns to check for are as follows
Blocking_session_id:- If this shows a non-zero number then you have blocking going on
Wait_type , wait_time,wait_resource :- These columns give you an idea of what is the dominant wait types. Use this to look for multiple sessions waiting on similar waits.
Total_elapsed_time, cpu_time:- these correspond to total time spent by the query vs. time spent on CPU.A big difference between these two typically indicates we are waiting.
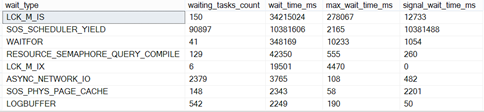
Sys.dm_db_wait_stats :- Use this DMV primarily to understand what your dominant wait type is
SELECT
wait_type
AS
wait_type, waiting_tasks_count, wait_time_ms, max_wait_time_ms, signal_wait_time_msFROM
sys.dm_db_wait_statsWHERE
waiting_tasks_count
> 0 OR
wait_time_ms
> 0 OR
signal_wait_time_ms
> 0ORDER
BY
wait_time_ms
DESCFor example here is the output from my database after running a blocking scenario. As expected, locks (i.e. LCK_*) show up as the top wait type
Execution Plans
For ad-hoc query or stored procedures that are executing slower than expected, but do not show you a dominant wait type, you can get the execution plan from Management Studio by hitting Ctrl+M ( Include Actual Execution Plan)
You can then look for any issues in the execution plan. Here are a few common ones that we see all the time
Missing Indexes will typically be shown at the top of the execution plan as follows

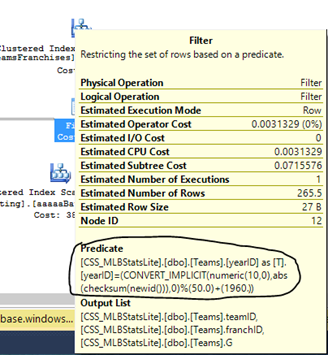
Implicit Conversions can be found in the operators in the execution plan e.g.
Connectivity related DMVs
Sys.event_log, sys.database_connection_stats:- Use these DMVs to understand connectivity and throttling errors & deadlocks against your user database
Here is a screenshot of how it appears in the Management Portal (under SQL Database àDashboard)
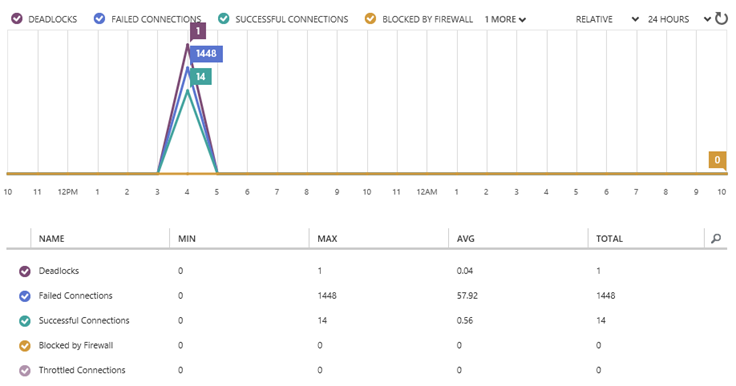
sys.database_connection_stats provides you a high level view of successful vs failed connections and further breaks down the failed connections as failed /terminated/throttled. More information about this DMV is outlined here
select
*
from
sys.database_connection_stats
where
start_time
>=
CAST(FLOOR(CAST(getdate()
AS
float)) AS
DATETIME)
order
by
start_time
desc

Sys.event_log gives you detailed reason for connection failures.
select
*
from
sys.event_log
where
event_type
<>
'connection_successful'
and
start_time
>=
CAST(FLOOR(CAST(getdate()
AS
float)) AS
DATETIME)
order
by
start_time
desc

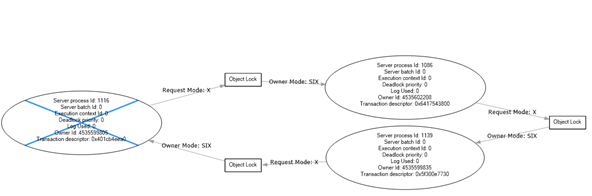
Additionally it also displays any deadlocks. More information about this DMV is outlined here

For deadlocks you can click on the additional_data column, save the output as an xdl file & get to the graphical deadlock graph as follows
Resource Usage related DMVs
Sys.resource_stats,sys.resource_usage :- Use it to baseline your database performance metrics.
For all practical purposes, the output from sys.resource_stats can be used to baseline your database performance. More information about this DMV is outlined here
Here is typical output from it for a database where I kept adding rows of data into a table
SELECT
*
FROM
sys.resource_statsWHERE
start_time
>=
CAST(FLOOR(CAST(getdate()
AS
float)) AS
DATETIME)--and database_name='ihavedeadlocks'
ORDER
BY
start_time
DESC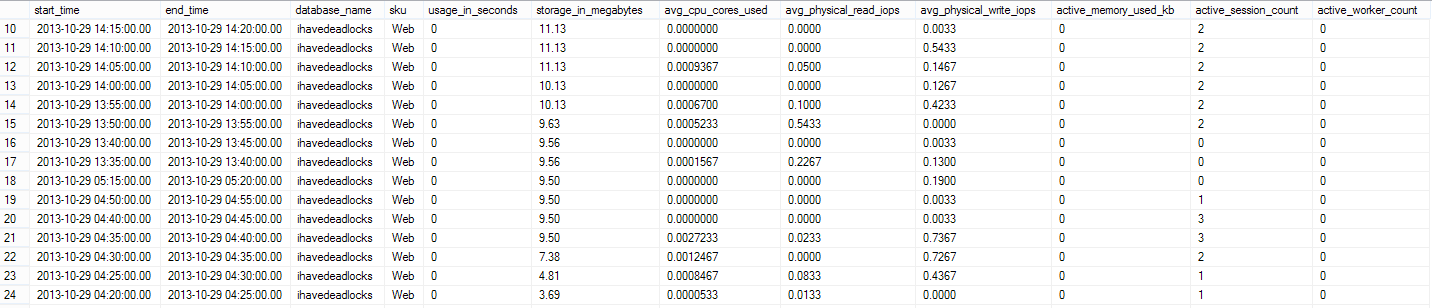
Putting it all together
In the on premise world we have long had a collection of scripts (sometimes called the PerfStats scripts) to collect DMV information from SQL Server. We have updated those scripts for the cloud and added the cloud-specific DMVs. The scripts are available for your download here. Additionally, when you open a support case for certain support topic areas the latest version of the scripts will be sent as part of an automated data collection (see KB article 2843748). Running the automated diagnostic and uploading the results can assist support with resolving your performance or connectivity problem more quickly.
References
- System Views (Windows Azure SQL Database) https://msdn.microsoft.com/en-us/library/windowsazure/ee336238.aspx#sqlazure
Author: - Rohit Nayak (@sqlrohit)
Reviewers: - Keith Elmore, José Batista-Neto
Escalation Services, Microsoft