Trending with Temporal tables
Trending is a very important component for BI work. For a customer, it's important know where they've been relative to where they are now; as well as help indicate where they're headed. In the past, this was typically accomplished by storing historical records in the same table or in history tables. This certainly is an acceptable option, but it does require management within the code base to know where and how to retrieve the historical data. Wouldn't it be nice to have SQL Server intrinsically manage that historical data? Well, beginning with SQL Server 2016, Temporal tables were introduced as means to provide system versioning for data. In this post, I'll discuss using Temporal tables to enable trending capabilities.
While the scope of this post is to cover the use of Temporal tables, it's important to also cover some of the basic requirements of Temporal tables in an effort to level-set knowledge. As defined in the Microsoft docs (https://docs.microsoft.com/en-us/sql/relational-databases/tables/temporal-tables):
- Temporal tables must have a Primary Key defined.
- Temporal tables must have only 1 PERIOD FOR SYSTEM_TIME defined with two datetime2 columns, declared as GENERATED ALWAYS AS ROW START / END
- The history table must always be schema-aligned with the current or temporal table, in terms of number of columns, column names, ordering and data types.
It's probably a good idea to review all of the official Microsoft docs for Temporal tables (/en-us/sql/relational-databases/tables/temporal-tables). This will be very helpful in understanding all the different permutations of this feature that are well beyond the scope of this post.
Now on to the good stuff...In my blog series "Reporting on SCOM Data", I covered how we're reporting current SCOM Health State and Alert counts. This gives us a nice snapshot of what's going on now. What it doesn't do is provide a history of Health State or Alert counts. What if we wanted to see our Health State or Alert counts from 2 weeks back? What if we wanted to see how our Health and/or Alert counts have changed over the last 2 weeks? To support this, the data would need to be maintained over time rather than just a current snap shot. In the past, we would manually maintain that history. However, with the introduction of Temporal tables, that functionality is provided with an out-of-the-box feature.
I've modified the Host table from my post Reporting on SCOM Data: Piecing the data together (Part 1) for simplification and to include our new datetime2 columns. As you can see, the T-SQL is very similar to the creation of a normal table.
 CREATE TABLE Host (
    [HostId] [int] IDENTITY(1,1) NOT NULL PRIMARY KEY CLUSTERED,
    [DnsHostName] [nvarchar](255) NULL,
    [EntityHealth] [tinyint] NULL,
    [AvailabilityHealth] [tinyint] NULL,
    [ConfigurationHealth] [tinyint] NULL,
    [PerformanceHealth] [tinyint] NULL,
    [SecurityHealth] [tinyint] NULL,
    [WarningOpenAlertCount] [int] NULL,
    [CriticalOpenAlertCount] [int] NULL,
    [SysStartTime] [datetime2] GENERATED ALWAYS AS ROW START NOT NULL,
    [SysEndTime] [datetime2] GENERATED ALWAYS AS ROW END NOT NULL,
    PERIOD FOR SYSTEM_TIME (SysStartTime, SysEndTime)
)
WITH (
    SYSTEM_VERSIONING = ON (HISTORY_TABLE = dbo.HostHistory)
);
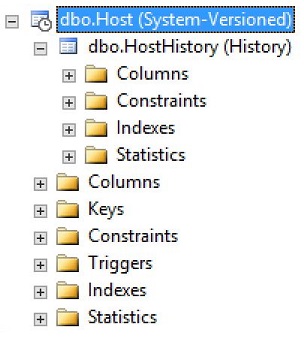
Here's what the new table looks like in SSMS. The current (Temporal) "Host" table is indicated as "System-Versioned" and has a new child node called "HostHistory". This is the history table.
We've now got a structure that we can use to store data. Let's add some rows to it.
 INSERT INTO
    Host (DnsHostName, EntityHealth, AvailabilityHealth, ConfigurationHealth, PerformanceHealth, SecurityHealth, WarningOpenAlertCount, CriticalOpenAlertCount)
VALUES
    ('HOST1.DOMAIN.COM', 1, 1, 1, 1, 1, 0, 0)

INSERT INTO
    Host (DnsHostName, EntityHealth, AvailabilityHealth, ConfigurationHealth, PerformanceHealth, SecurityHealth, WarningOpenAlertCount, CriticalOpenAlertCount)
VALUES
    ('HOST2.DOMAIN.COM', 1, 1, 1, 1, 1, 0, 0)

INSERT INTO
    Host (DnsHostName, EntityHealth, AvailabilityHealth, ConfigurationHealth, PerformanceHealth, SecurityHealth, WarningOpenAlertCount, CriticalOpenAlertCount)
VALUES
    ('HOST3.DOMAIN.COM', 1, 1, 1, 1, 1, 0, 0)

INSERT INTO
    Host (DnsHostName, EntityHealth, AvailabilityHealth, ConfigurationHealth, PerformanceHealth, SecurityHealth, WarningOpenAlertCount, CriticalOpenAlertCount)
VALUES
    ('HOST4.DOMAIN.COM', 1, 1, 1, 1, 1, 0, 0)
With data now added to the Host table, let's take a look at the records in both tables. Selecting directly from each table individually is exactly the same as a normal (non system-versioned) table.
 SELECT
    HostId,
    DnsHostName,
    EntityHealth,
    AvailabilityHealth,
    ConfigurationHealth,
    PerformanceHealth,
    SecurityHealth,
    WarningOpenAlertCount,
    CriticalOpenAlertCount,
    SysStartTime,
    SysEndTime
FROM
    Host

 SELECT
    HostId,
    DnsHostName,
    EntityHealth,
    AvailabilityHealth,
    ConfigurationHealth,
    PerformanceHealth,
    SecurityHealth,
    WarningOpenAlertCount,
    CriticalOpenAlertCount,
    SysStartTime,
    SysEndTime
FROM
    HostHistory

As you can see, we've only got records in the current (Temporal) Host table. Note the "SysEndTime" column values of "9999-12-31 23:59:59.999999". This value indicates that this record is the current version of that record. This value comes in handy when we sort on all the current and historical versions. We'll see this later.
Now let's update a couple of the Host records and check the tables again.
 UPDATE Host SET WarningOpenAlertCount = 3 WHERE HostId = 2
UPDATE Host SET CriticalOpenAlertCount = 5 WHERE HostId = 3
Using the same SELECT statements as before, here are what the records look like.
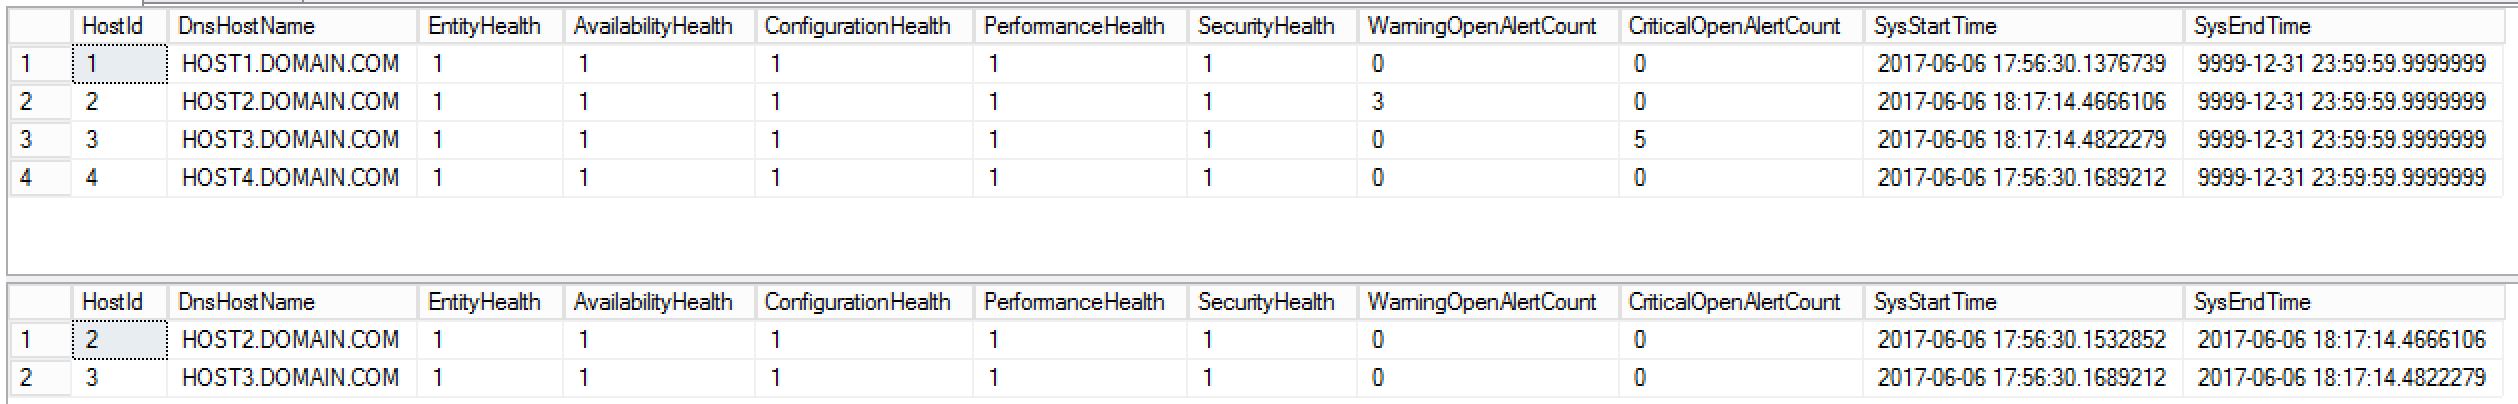
In the second table, you can see the previous versions of the rows that we updated. These new records in that table demonstrate the intrinsic versioning functionality of Temporal tables.
Querying the Temporal and history tables directly is great, but we want to return history so we can report trends on that data. Let's update the same records again so we'll have a little more data to report on.
 UPDATE Host SET WarningOpenAlertCount = 4 WHERE HostId = 2
UPDATE Host SET CriticalOpenAlertCount = 8 WHERE HostId = 3
Here's what that SELECT statement would look like to retrieve the current version and all historical versions of the records for Hosts 2 & 3.
 SELECT
    HostId,
    DnsHostName,
    EntityHealth,
    AvailabilityHealth,
    ConfigurationHealth,
    PerformanceHealth,
    SecurityHealth,
    WarningOpenAlertCount,
    CriticalOpenAlertCount,
    SysStartTime,
    SysEndTime
FROM
    Host FOR SYSTEM_TIME ALL
WHERE
    HostId = 2
    OR HostId = 3
ORDER BY
    HostId,
    SysStartTime,
    SysEndTime
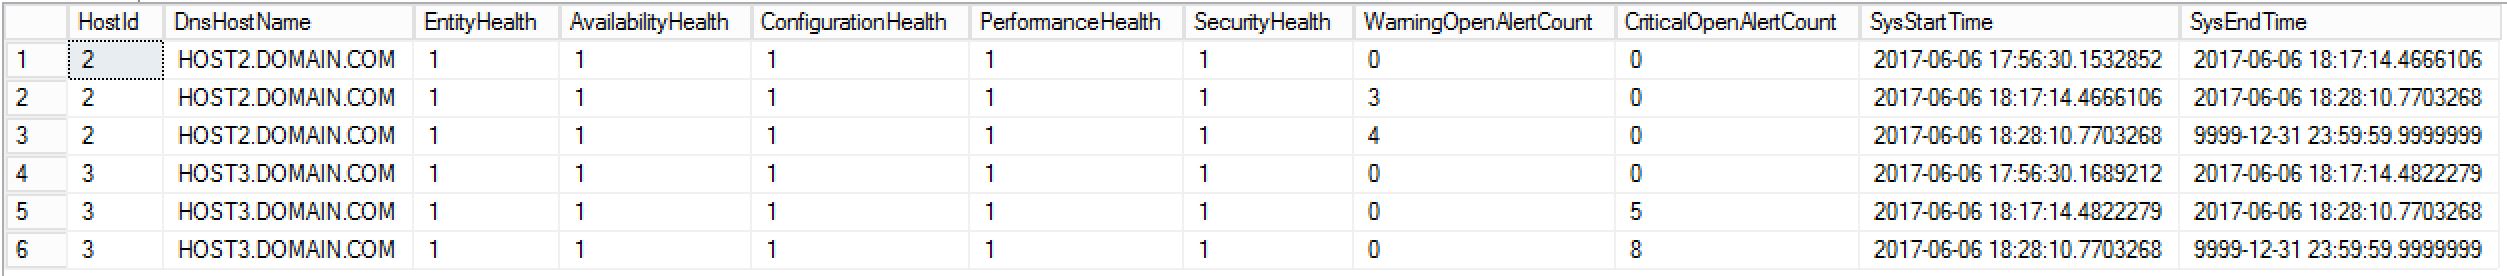
Above you can see the current and all of the historical records for each Host. Note how the SysEndTime values I mentioned earlier in the post sort exactly how we would want with our ORDER BY clause. The best part of all is that we didn't have to manage additional tables or records to leverage this functionality.
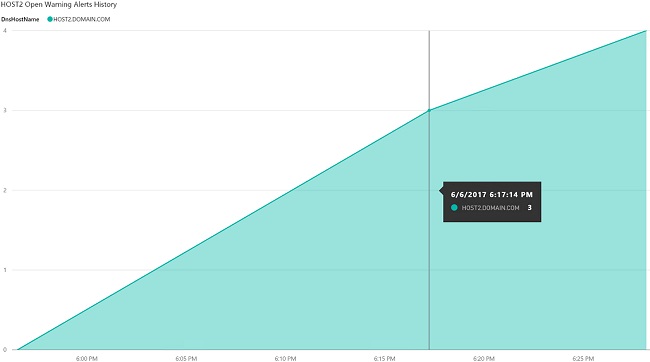
In our example, we're only looking at the Open Alert Counts, but the same techniques could be used for any of the Health States as well. Taking things further, building a visualization for this data would be fairly simple. An example in Power BI might look something like this.
While we are using a small sampling of data for our example, hopefully this gives you enough of an idea of how you can leverage Temporal tables to provide trending capabilities for the data that you work with.
Viel Spaß!
Joseph