SQL Server 2016 – Added information on TempDB Spill events – xEvents
My previous post was about new information added to spill warnings. Those are visible at the query plan level, but what about if you need to track for an extended period of time?
While spills are something that denotes some type of inefficiency, starting with IO usage where only memory usage was expected, but also estimation skews, they are introduced so that a query execution doesn’t exhaust the server’s memory and can effectively continue execution in spite its allocated resources are running out (memory spills).
Much like the enhancements in showplan, the xEvent enhancements introduced here are aimed at giving more contextual information over these unwarranted events and allow you to take action to optimize from a database and query design standpoints, to influence the optimizer to produce different choices.
The sort_warning and hash_warning extended events have been available for several versions of SQL Server, and they give you insight on the fact those events have happened and what type. It is actually the same information as SQL Profiler sort_warning and hash_warning events have available.
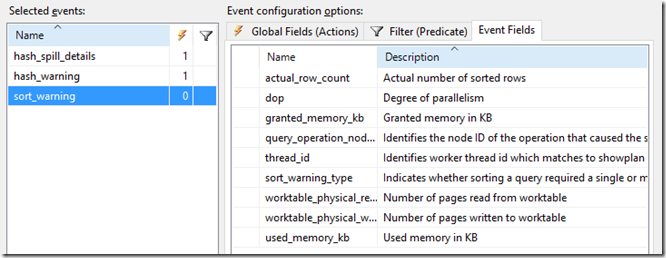
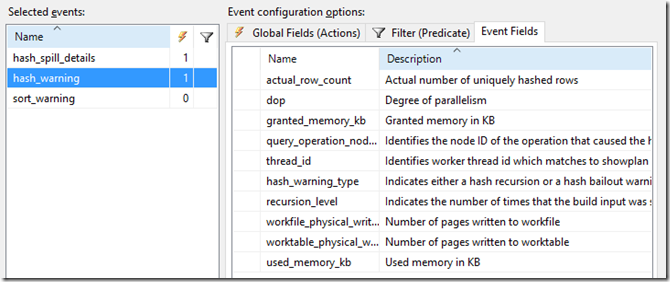
With SQL Server 2016, the information (event fields) you can retrieve from these 2 warnings have been greatly enhanced. Now can see the DOP level, how many pages were involved in the spill, memory statistics for the operator, the row count for the spill context (uniquely hashed for has warning, total sorted for sort warnings), besides the recursion level for hashing operations and the warning type, which were already present.
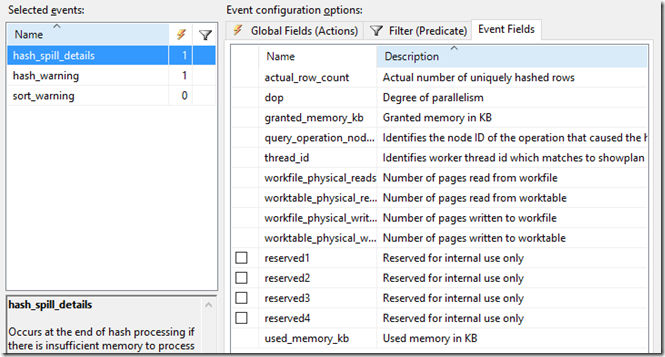
For hashing related spills, we also added a new Extended Event hash_spill_details. These will be triggered at the end of hash processing, if there is insufficient memory to process the build input of a hash join. Use this event together with any of the query_pre_execution_showplan or query_post_execution_showplan events to determine which operation in the generated plan is causing the hash spill.
Note that the event fields on this one are also present in the existing warning events (see below), in the proper context of either a sort or warning.
Below you can see the detailed differences between the sort_warning event up to SQL Server 2014 (top), and in SQL Server 2016 (bottom):
And the detailed differences between the hash_warning event up to SQL Server 2014 (top), and in SQL Server 2016 (bottom):
I used the below session definition to capture the same execution of a hash spill as we saw in the previous post on showplan:
 CREATE EVENT SESSION [Spills] ON SERVER
ADD EVENT sqlserver.hash_spill_details(
    ACTION(sqlserver.sql_text)),
ADD EVENT sqlserver.hash_warning(
    ACTION(sqlserver.sql_text)),
ADD TARGET package0.event_file(SET filename=N'H:\Demo\Spills.xel',max_file_size=(50),max_rollover_files=(2))
WITH (MAX_MEMORY=4096 KB,EVENT_RETENTION_MODE=ALLOW_SINGLE_EVENT_LOSS,MAX_DISPATCH_LATENCY=30 SECONDS,MAX_EVENT_SIZE=0 KB,MEMORY_PARTITION_MODE=NONE,TRACK_CAUSALITY=OFF,STARTUP_STATE=OFF)
GO
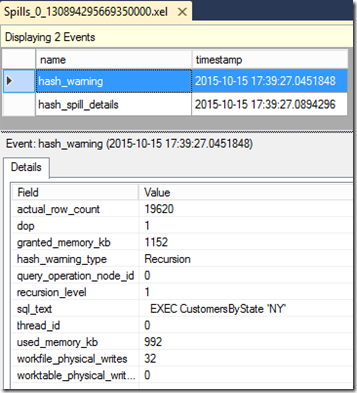
The output is below, and allows you to track hash spills as your workload executes, while giving more insight on what was happening, and what are the effects on your workload.
Pedro Lopes (@sqlpto) - Program Manager


