New in SSMS: Performance Dashboard built-in
Back in 2007, we released the Microsoft SQL Server 2005 Performance Dashboard Reports, which were designed to provide fast insight into performance issues from some newly created system views – DMFs (Dynamic Management Views). These were updated for SQL Server 2008 and later to SQL Server 2012, and while being very helpful they had a significant drawback – required separate download and install. This meant that when needed, most probably they were not installed in a specific SQL Server, and therefore were unusable when they were needed the most.
With the new SSMS 17.2, we are releasing the Performance Dashboard embedded as a built-in Standard Report. This means that it is available for any SQL Server instance starting with SQL Server 2008, without any extra downloads or running any extra scripts. Just connect to your server in SSMS and open the Performance Dashboard.
How to start it?
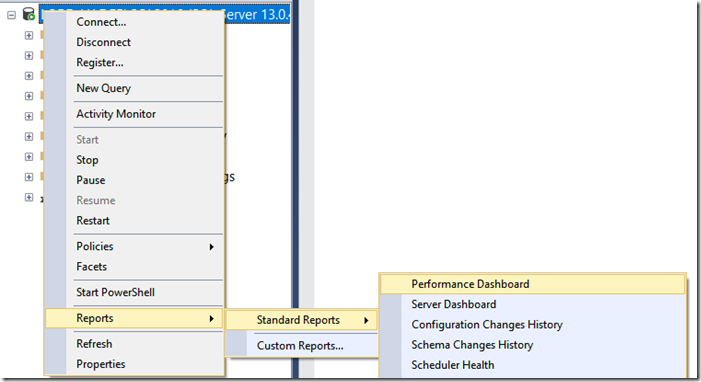
As seen below, just bring up the Reports context menu at the server level, and select the Standard Reports.
What to use it for?
The Performance Report allows a DBA to quickly identify whether there is any current performance bottleneck on the connected SQL Server. And if a bottleneck is found, easily capture additional diagnostic data that may be necessary to resolve the problem. Some common performance problems where the Performance Dashboard can help to solve include:
- CPU bottlenecks (and what queries are consuming the most CPU)
- I/O bottlenecks (and what queries are performing the most IO)
- Index recommendations generated by the query optimizer (missing indexes)
- Blocking
- Resource contention (including latch contention)
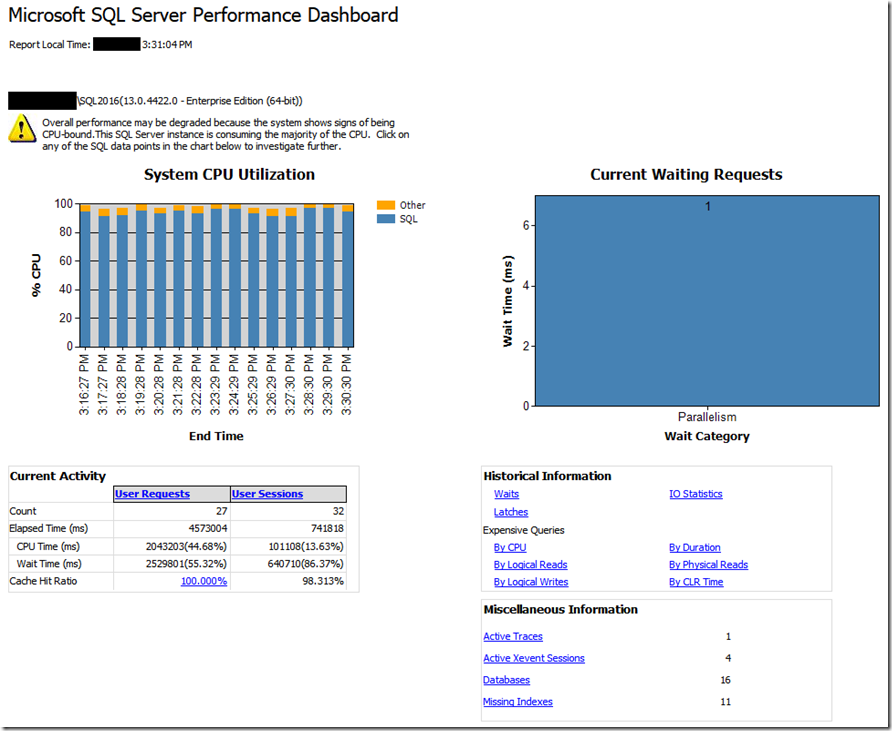
See below an example where a CPU bottleneck is present:
What has changed since the 2012 release?
Besides being completely self-contained in SSMS, we have made a few changes to improve usability:
- Under Historical Information section:
- Added wait categorization to Waits report.
- Filtered out all idle and sleep waits from Waits report.
- Added new Latches report.
- Under Miscellaneous Information, added a score column to the report. This report shows potential indexes that the query optimizer identified during query compilation. However, these recommendations should not be taken at face value.
- We recommend that only the indexes with a score greater than 100,000 should be evaluated for creation, as those have the highest anticipated improvement for user queries.
- Also, always evaluate if a new index suggestion is comparable to an existing index in the same table, where the same practical results can be achieved simply by changing an existing index instead of creating a new index. For example, given a new suggested index on columns C1, C2 and C3, first evaluate if there is an existing index over columns C1 and C2. If so, then it may be preferable to simply add column C3 to the existing index (preserving the order of pre-existing columns) to avoid creating a new index.
What permissions are needed to run the report?
This is aimed at sysadmin roles. Other roles require VIEW SERVER STATE and ALTER TRACE permissions.
Check out a demo of this and other SSMS features in the Tiger YouTube channel.
Pedro Lopes (@sqlpto) – Senior Program Manager

