Indirect Checkpoint and tempdb – the good, the bad and the non-yielding scheduler
Indirect checkpoint was first introduced in SQL Server 2012 to provide predictable database recovery governed by target_recovery_time option set at the database level. In SQL Server 2016, indirect checkpoint is ON by default with target_recovery_time set to 60 seconds for model database. The conventional or automatic checkpoint algorithm assumes fixed time interval to recover each log record without accounting for the number of pages dirtied by a database transaction. In simpler terms, when (number of log records * fixed time interval to recover a log record) exceeds recovery interval set at the instance level, automatic checkpoint is triggered on the database. As automatic checkpoint doesn't account for the dirty pages from each transaction (an important influencer of recovery time), it makes the recovery time less predictable. With indirect checkpoint, the engine maintains partitioned dirty page lists per database to track the number of dirty pages in the buffer pool for that database from each transaction. When the background recovery writer polling the dirty page manager detects the condition, where the number of dirty pages exceeds the dirty page threshold (calculated by heuristics), the recovery writer would trigger the flush of dirty pages to ensure database recovery would complete within the target_recovery_time set. In addition to predictable recovery time, the advantage of indirect checkpoint is, it smoothens the large IO burst activity observed with automatic checkpoints especially on high end machines with large memory to improve the overall IO latency and throughput of SQL Server instance. For example, backup of a database on large memory system can take long times with automatic checkpoint when a checkpoint (flushcache) is issued during backup which takes longer with longer IOs if indirect checkpoint is not enabled on the database.
Now that we understand the benefits of indirect checkpoint, let's take a closer look at how recovery writer works internally to efficiently handle heavy transactional activity on the database. Recovery writer is a background thread like lazywriter thread which wakes up periodically based on a timed event to poll dirty page list. In addition to the timed wait, the recovery writer wake up is triggered if dirty pages exceeds the dirty page threhold. DIRTY_PAGE_POLL is a new system waittype introduced to support timed wait of recovery writer thread and if you see it as one of the high wait events in sys.dm_os_wait_stats, you can safely ignore it. When target_recovery_time is set at the database level, indirect checkpoint is activated and dirty page manager is created for the database. The dirty page manager maintains the dirty page lists for the database. For each database, we have dirty page list partitioned into 128 DPLists per database. Partitioned DPLists help improves concurrency and avoids any contention with each worker thread running on a scheduler writing to its corresponding dirty page list (Scheduler [0] -> DPList[0], Scheduler [1] -> DPList [1]). Due to this, when the transactional activity on the database is low (<3k-5k transactions per second), the overhead of tracking dirty pages in DPList is minimal and doesn't impact the overall throughput of the workload running on the database with indirect checkpoint.
When the total number of dirty pages exceeds the dirty page threshold (calculated internally from target_recovery_time), the recovery writer wakes up, swaps the list and starts iterating through the DPList in the loop starting with the longest DPList, collecting the Page IDs and sorting the pages in the list to optimize and bundle writes together and finally posts asynchronous write request to write the pages as shown in the figure below. The IO completion (IOC) routine picks up the sorted dirty pages up to 128 contiguous pages in one IO write operation for completion. 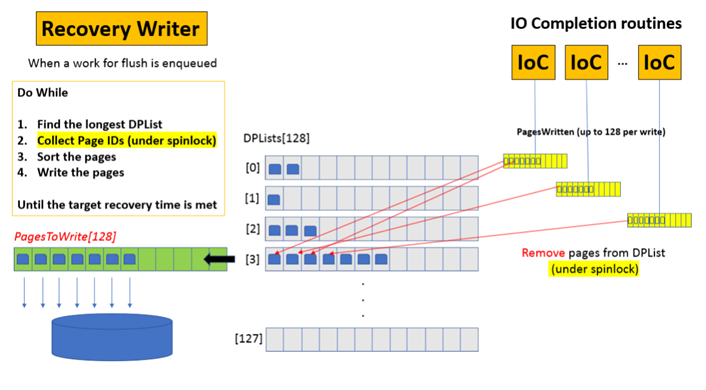
The recovery writer acquires spinlock on DPList during the PageID collection while IOC threads also require spinlock on the same DPList to remove pages from the list when writes are completed. This results into healthy spinlock contention between recovery writer and IoC routine threads. While we can have multiple IoC threads (typically one per scheduler) to perform post-write processing, there is only one recovery writer per SQL Server instance. On highly transactional systems, the recovery writer may start falling behind due to high number of pages dirtied in short time or IO not catching up. If recovery writer starts falling behind resulting into long DPLists, the individual worker threads running on the scheduler starts playing the role of recovery writer to collect, sort and post write for dirty pages. This allows recovery writer to scale dynamically on heavy OLTP systems to ensure target_recovery_time interval set is met all the time. While multiple recovery writer routine running aggressively allows us to meet the target_recovery_time for predictable recovery, the overall throughput of workload may degrade under these circumstances due to additional overhead caused from each running worker performing recovery writer activity.
As mentioned earlier, each running worker thread populates the pages dirtied from the running batch into the respective DPList. As a result, if you have few long running batches, dirtying multiple buffers in a single worker thread execution, the distribution of dirty pages in the DPList gets skewed with few very long DPLists as shown in the figure above. For example, we have seen the single DPList growing with more than 20K-30K pages in the list with remaining lists relatively free. Under these circumstances, the recovery writers need to work aggressively on those longer lists while multiple IoC threads simultaneously writing and removing pages from the same list. In this scenario, the spinlock contention between recovery writer threads and IOC threads begins to become a bottleneck chewing additional CPU cycles and degrading the overall throughput of the workload.
One of the scenarios where skewed distribution of dirty pages in the DPList is common is tempdb. Starting SQL Server 2016, indirect checkpoint is turned ON by default with target_recovery_time set to 60 for model database. Since tempdb database is derived from model during startup, it inherits this property from model database and has indirect checkpoint enabled by default. As a result of the skewed DPList distribution in tempdb, depending on the workload, you may experience excessive spinlock contention and exponential backoffs on DPList on tempdb. In scenarios when the DPList has grown very long, the recovery writer may produce a non-yielding scheduler dump as it iterates through the long list (20k-30k) and tries to acquire spinlock and waits with exponential backoff if spinlock is taken by multiple IOC routines for removal of pages.
If you see non-yielding schedulers in your environment due to this, you will see the following symptoms
Errorlog
Messages Reported in Errorlog
Process 0:0:0 (0x34c0) Worker 0x000000FCD89BC160 appears to be non-yielding on Scheduler 9. Thread creation time: 13140343858116. Approx Thread CPU Used: kernel 0 ms, user 60968 ms. Process Utilization 13%. System Idle 86%. Interval: 70234 ms.
Process 0:0:0 (0x34c0) Worker 0x000000FCD89BC160 appears to be non-yielding on Scheduler 9. Thread creation time: 13140343858116. Approx Thread CPU Used: kernel 0 ms, user 120718 ms. Process Utilization 12%. System Idle 86%. Interval: 135452 ms.
Process 0:0:0 (0x34c0) Worker 0x000000FCD89BC160 appears to be non-yielding on Scheduler 9. Thread creation time: 13140343858116. Approx Thread CPU Used: kernel 0 ms, user 172343 ms. Process Utilization 12%. System Idle 87%. Interval: 195671 ms.
Process 0:0:0 (0x34c0) Worker 0x000000FCD89BC160 appears to be non-yielding on Scheduler 9. Thread creation time: 13140343858116. Approx Thread CPU Used: kernel 0 ms, user 228828 ms. Process Utilization 12%. System Idle 87%. Interval: 255890 ms.
A time-out occurred while waiting for buffer latch -- type 3, bp 0000010C1900C6C0, page 4:323520, stat 0x10f, database id: 2, allocation unit Id: 6488064, task 0x000000FE6076D088 : 0, waittime 300 seconds, flags 0x19, owning task 0x00000102ED0C8108. Not continuing to wait.
A time-out occurred while waiting for buffer latch -- type 3, bp 0000010C1900C6C0, page 4:323520, stat 0x10f, database id: 2, allocation unit Id: 6488064, task 0x000001033B2D7C28 : 0, waittime 300 seconds, flags 0x39, owning task 0x00000102ED0C8108. Not continuing to wait.
Non-Yielding Scheduler Dump
When you load the associated non-yielding scheduler dump in Windbg, load the symbols and see the stack of the thread non-yielding, you will see the following stack
00 sqlmin!Spinlock<100,11,1>::SpinToAcquireWithExponentialBackoff
01 sqlmin!DirtyPageMgr::WrotePage
02 sqlmin!RecoveryUnit::WrotePage
03 sqlmin!BPool::WritePageCompletion
04 sqlmin!FCB::IoCompletion
05 sqldk!IOQueue::CheckForIOCompletion
06 sqldk!SOS_Scheduler::SwitchContext
07 sqldk!SOS_Scheduler::SuspendNonPreemptive08 sqlmin!EventInternal<SuspendQueueSLock>::Wait
09 sqlmin!LatchBase::Suspend
0a sqlmin!BUF::AcquireLatch
0b sqlmin!BPool::Get
To detect if your SQL Server instance is experiencing excessive spinlock contention on DPList even if there is no non-yielding scheduler detected, you can use the following diagnostics available in SQL Server
DMV
Use sys.dm_os_spinlock stats DMV to look for a high number of spins and backoff events over periods of time. Run the following query multiple time in the interval of 1 min. Calculate the difference between the snapshot to identify the number of spins and backoffs between the consecutive snapshots.
Note: It is expected to see some spins and backoffs due to healthy spinlock contention between the recovery writers and IoC threads so you will have to compare the different snapshot to see if exponential backoff continues to increase.
select getdate() as'Date Captured',* from sys.dm_os_spinlock_stats where name ='DP_LIST'
XEvents
You can use the following script to capture Xevent for spinlock backoff for DPList in your environment. The Callstack captured from the Xevents can be analyzed using SQLCallStackResolver developed by Arvind Shyamsundar.
select map_value, map_key, name from sys.dm_xe_map_values
where map_value LIKE ('DirtyPageList')
create event session spin_lock_backoff on server
add event sqlos.spinlock_backoff
(action (package0.callstack)
where type = 100 ) --Map value for DirtyPageList from previous query
add target package0.asynchronous_bucketizer
(set filtering_event_name='sqlos.spinlock_backoff',
source_type=1,
source='package0.callstack')
with (MAX_MEMORY=50MB, MEMORY_PARTITION_MODE = PER_NODE)
alter event session spin_lock_backoff on server state=start
select * from sys.dm_xe_sessions where name = 'spin_lock_backoff'
waitfor delay '00:01:00'
select event_session_address, target_name, execution_count, cast (target_data as XML)
from sys.dm_xe_session_targets xst
inner join sys.dm_xe_sessions xs on (xst.event_session_address = xs.address)
where xs.name = 'spin_lock_backoff'
alter event session spin_lock_backoff on server state=stop
drop event session spin_lock_backoff on server
Recommendations
If you have experienced non-yielding scheduler in your environment and non-yielding callstack resembles similar to the list above, we recommend disabling the indirect checkpoint on tempdb using startup stored procedure as shown below. (Below script requires you to run it with sysadmin priviledges). Alternatively, you can disable indirect checkpoint on tempdb by setting target_recovery_time to 0 for model database but we do not recommend it since it disables indirect checkpoint on any new user database created on the instance and depending on the memory on your server, it can degrade the performance for create database, backup database as checkpoint may take long to flush cache and lead to IO burst.
Edit [Pam Lahoud, 14 September 2018] : Note that since this blog was originally published we have documented a trace flag which will disable indirect checkpoint on tempdb on startup. If you would like to disable indirect checkpoint on tempdb you can add TF 3468 to the startup parameters of your SQL Server instance.
USE MASTER
GOsp_configure 'show advanced options',1
reconfiguresp_configure 'scan for startup procs',1
reconfigureCREATE PROCEDURE usp_disable_indirectchkpt_tempdb
AS BEGIN-- whenever instance starts up (using startup stored procedure)
ALTER DATABASE [tempdb] SET TARGET_RECOVERY_TIME = 0 MINUTES
ENDEXEC SP_PROCOPTION usp_disable_indirectchkpt_tempdb,'STARTUP','ON'
GOselect name,target_recovery_time_in_seconds from sys.databases
where database_id=2-- Restart SQL Server
-- Verify if target_recovery_time is set to 0 for tempdbselect name,target_recovery_time_in_seconds from sys.databases
where database_id=2If you are running SQL Server 2016, we highly recommend monitoring and capture the output of sys.dm_os_spinlock stats DMV for DP_LIST spinlock periodically to establish a baseline and detect spinlock contention on DP_List.
For tempdb, there is no recovery goals as it is recreated on restart so indirect checkpoints on tempdb may not make much sense from recovery perspective but indirect checkpoint is still important to ensure the dirty pages in tempdb do not continue to take away buffer pool pages from user database workload as automatic checkpoint doesn't flushpages for tempdb. In this scenario, we recommend tuning the target_recovery_interval to higher value (5-10 mins) for recovery writer to be less aggressive and to avoid tempdb consuming excessive BPOOL buffers and producing fake internal memory pressure. This scenario can also be avoided by running manual checkpoint job every 30-60 mins, if you do not wish to enable indirect checkpoint on tempdb due to spinlock contention overhead.
If you are evaluating or planning to upgrade to SQL Server 2016, it is important to compare performance of your workload with indirect checkpoint (multiple target_recovery_time) and without indirect checkpoint and choose the most optimal setting for your environment.
Parikshit Savjani
Senior PM, SQL Server Tiger Team Twitter | LinkedIn
Follow us on Twitter: @mssqltiger | Team Blog: Aka.ms/sqlserverteam