Chart behavior difference in SQL Reporting Services 2008
There are some changes in behavior in Reporting Services Charts with regards to “Empty Points” between SQL 2005 and SQL 2008 (https://msdn.microsoft.com/en-us/library/dd207051.aspx)
Let us consider the following Dataset:
create table #TestChart
(
Runtime datetime,
SensorReading int,
SensorName varchar(20)
)
insert into #TestChart values('2009-01-30 1:30:00',165,'SENSOR_A')
insert into #TestChart values('2009-01-30 1:31:00',145,'SENSOR_B')
insert into #TestChart values('2009-01-30 5:30:00',135,'SENSOR_A')
insert into #TestChart values('2009-01-30 5:31:00',185,'SENSOR_B')
insert into #TestChart values('2009-01-30 9:30:00',165,'SENSOR_A')
insert into #TestChart values('2009-01-30 9:31:00',115,'SENSOR_B')
insert into #TestChart values('2009-01-30 13:30:00',115,'SENSOR_A')
insert into #TestChart values('2009-01-30 13:31:00',125,'SENSOR_B')
insert into #TestChart values('2009-01-30 17:30:00',155,'SENSOR_A')
insert into #TestChart values('2009-01-30 17:31:00',165,'SENSOR_B')
insert into #TestChart values('2009-01-30 21:30:00',145,'SENSOR_A')
insert into #TestChart values('2009-01-31 1:30:00.130',135,'SENSOR_A')
select * from #TestChart
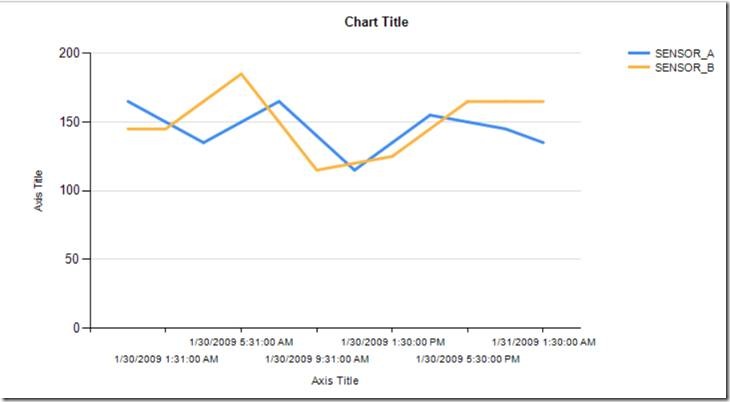
If we had a Chart in SQL 2005 based on this data it would look like the image below:
SQL 2005 Chart
This was incorrect behavior. To give an analogy, let’s say that you only have data for Mon, Tues, Fri, on one instrument, and you have data for Wed and Thursday on the second instrument. If you try to plot the days along the X axis, due to the fact that the chart is going to show 5 days worth of data, each instrument now effectively has 5 days worth of data that could be shown. The chart builds its own internal data structure to support that view. If there isn’t data present for a particular point , it is considered as an EmptyPoint. You simply shouldn’t be drawing a line that goes from Tuesday to Friday for the first instrument because it doesn’t have any data for Wed or Thursday. For a line chart, a line will be drawn only across 2 or more contiguous points.
For the Dataset above,
Intersection calculated internally:
currentdttm ( X-axis) |
1/30/09 1:30 AM |
1/30/09 1:31 AM |
1/30/09 5:30 AM |
1/30/09 5:31 AM |
1/30/09 9:30 PM |
1/31/09 1:30 AM |
Sensor_A |
EmptyPoint |
145 |
EmptyPoint |
185 |
EmptyPoint |
EmptyPoint |
Sensor_B |
165 |
EmptyPoint |
135 |
EmptyPoint |
145 |
135 |
Now the chart cannot plot a line without 2 contiguous values, and the only 2 contiguous values are the ones highlighted above for the same series.
Attached is an RDL that demonstrates my point. With the dataset above the chart would appear as below given that there were only 2 contiguous points it could plot.
SQL 2008 Chart
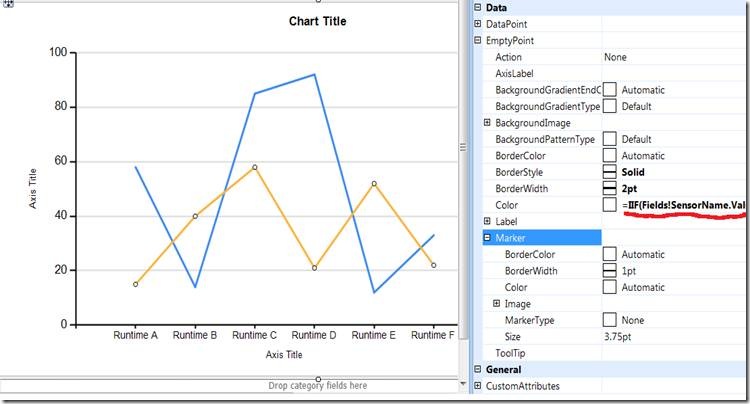
While it is a different behavior from 2005, the 2005 behavior is the incorrect behavior. If you look at Excel, Excel will plot the chart the same way as SQL 2008. SQL 2005 had quite a different behavior as it connected every point for the Series group irrespective if they were contiguous or not. SQL 2008 does expose properties to control what to do on an EmptyPoint which is a property of the Series. If we want to revert to the 2005 behavior, we would have to manipulate the properties of the EmptyPoint
In order to have the behavior that existed in SQL 2005, you have to change the Color property below with an expression below which basically is assigning the color based on the SeriesGroup.
=IIF(Fields!SensorName.Value="SENSOR_B", "#FCB441","#418CF0")
Also change all the other properties of the EmptyPoint to match those of the series.
By default, empty points are calculated by taking the average of the previous and next data points that contain a value. You can change this so that all empty points are inserted at zero
In the Properties pane, expand the CustomAttributes node.
Set the EmptyPointValue property. To insert empty points at an average of the previous and next data points, select Average. To insert empty points at zero, select Zero.
Resulting Chart will look like SQL 2005 Chart if that is necessary.
-Denzil Ribeiro, Sr. SQL Dedicated Premier Field Engineer


