LDAP client tracing...
ADinsight from the sysinternals toolset is a great tool , but I seem to have problems with it at times. Specifically on Server 2008 & Vista (maybe due to the way it hooks wldap32.dll)
On Vista OS and beyond, there is built in client ldap tracing which can give you similar results ( with a wee bitmore effort )
In order to start the trace you use tracelog.exe ( may be able to use logman.exe as well but I have not tried it )
First , create a new key under HKLM\System\CurrentControlSet\Services\ldap\tracing\
The key name should be the name of the .exe you want to trace , mmc.exe for example.
C:\tools>Tracelog.exe -start ldap -guid #099614a5-5dd7-4788-8bc9-e29f43db28fc -f ldap.etl -flag x1FFFDFF3
Logger Started...
Enabling trace to logger 23
Operation Status: 0L The operation completed successfully.
Logger Name: ldap
Logger Id: 0x17
Logger Thread Id: 00000EDC
Guid: 4a9f73a0-649c-11dd-84e5-0003ff1ee008
Buffer Size: 16 Kb
Maximum Buffers: 25
Minimum Buffers: 3
Number of Buffers: 3
Free Buffers: 2
Buffers Written: 1
Events Lost: 0
Log Buffers Lost: 0
Real Time Buffers Lost: 0
AgeLimit: 0
Real Time Consumers: 0
ClockType: PerfCounter
Log Mode: Sequential
Maximum File Size: not set
Buffer Flush Timer: not set
Log Filename: C:\tools\ldap.etl
After your repro or whatnot, when you want to stop the trace use the following command:
C:\tools>tracelog -stop ldap
Operation Status: 0L The operation completed successfully.
Logger Name: ldap
Logger Id: 0x17
Logger Thread Id: 00000EDC
Guid: 4a9f73a0-649c-11dd-84e5-0003ff1ee008
Buffer Size: 16 Kb
Maximum Buffers: 25
Minimum Buffers: 3
Number of Buffers: 4
Free Buffers: 4
Buffers Written: 1
Events Lost: 0
Log Buffers Lost: 0
Real Time Buffers Lost: 0
AgeLimit: 0
Real Time Consumers: 0
ClockType: PerfCounter
Log Mode: Sequential
Maximum File Size: not set
Buffer Flush Timer: not set
Log Filename: C:\tools\ldap.etl
In order to format the trace to a readable format use tracerpt.exe
C:\tools>tracerpt.exe ldap.etl -o ldap2.csv -of CSV
Input
----------------
File(s):
ldap.etl
100.00%
Output
----------------
DumpFile: ldap2.csv
The command completed successfully.
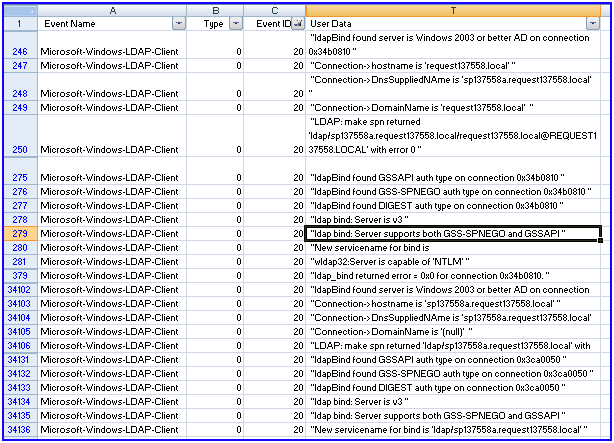
Now, open the CSV in excel . There is a whole gob of information, but I have found that if I filter the Event ID column I can easily get what I want from it.
Below I filter on ID = 20
Have fun with it... works nicely in a pinch when you don't have any other tools at your disposal except for the built in ones. Also works nice for the detailed returns and code flow, as well as how much time it took to perform.
spat