How to troubleshoot application crashes
Often when we encounter an application or service crash we have no clue what happened or what caused it, as we are only left with a little message saying that there was a problem and the applications needs to close. There are a few things we can do to try to figure out what is going on, so if you ever happen to open a service request with us we will probably ask you for the following information:
Event log
o Please take the log from both the machine where the RTC is installed and the server where the NAV service is running, or from the machine where the Classic Client is crashing if that is the case.
o Go to Administrative Tools -> Event viewer -> Application -> Save all events as -> save in .evt / .evtx format, on the machine right after you receive the error messages or application crashes.
Crash Dump
o Download (*) the Debug Diag tool on the server / machine where the RTC is running / machine with the Classic Client, depending on which is crashing, and select 32bit or 64bit version according to your server Operative System:
https://www.microsoft.com/download/en/details.aspx?id=26798
o Run DebugDiag 1.2 (not the Analysis only version).
o You will be prompted to add a rule (if not, go to Tools -> Rule Actions -> Add Rule).
Rule Type = Crash
Target Type = A specific process.
Select the process which is crashing (Microsoft.Dynamics.Nav.Client.exe, Microsoft.Dynamics.Nav.Server.exe or finsql.exe), and leave all the remaining settings by default.
o Once the RTC / service / Classic Client crashes, it should have created a crash dump/s which you can access in View –> Logs Folder.
* If you get the following error message when trying to install DebugDiag:

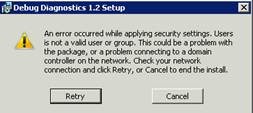
You can follow the steps described in this article:
1) Create local group named "Users"
2) Add yourself to this group
3) Grand full access to this group to DebugDiag installation folder
4) Install DebugDiag
5) Run Register.bat from the installation folder
OR
1) Install on an English OS to get the binaries
2) Copy all the binaries to \Debugdiag on the non-English machine
3) Run register.bat
Process Monitor trace
o You can download the tool from https://technet.microsoft.com/en-us/sysinternals/bb896645
o Run the tool and leave all filters by default. You can control when to start or stop taking traces by selecting File -> Capture Events.
o Activate the capture, and once the application crashes or the error message appears stop the capture again.
o Send us a copy of this in *.pml format for us to filter and analyze.
Juliet R. Moreiro Bockhop
Microsoft Dynamics NAV Support Engineer