Introducing Small Basics Monthly Challenge Statistics.
Today I’d like to introduce Small Basics Monthly Challenge Statistics.
They are provided for anyone who’s interested in community traffic in the challenge forum threads. They are updateable, responsive to community demand and sourced from the metrics displayed with each thread.
The idea to report these stats originates from the community and the Challenges themselves are originally a community invention.
The Challenges are a monthly set of real world programming tasks that deliver a popular service to the community to practice coding. They’ve been sticky since their conception.
The Statistics Package
The statistics and subsequent report treats the challenges as a going concern and aspires to present a true and fair view of activity and any interesting observations.
Hopefully this format will make it easy to maintain the stats, make them accessible and open to further contribution with broader scope and analysis.
Inside The Package is:
- Data Collection captured using a worksheet that is available at this gallery post;
- The Report which is delivered via one wiki article; and
- Announcements which originate here on the Small Basic Blog.
Preview of the Report
The Report contains a brief preamble and detailed discussion of the topics as shown in the Table of Contents.
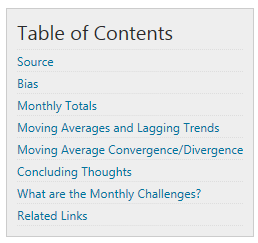
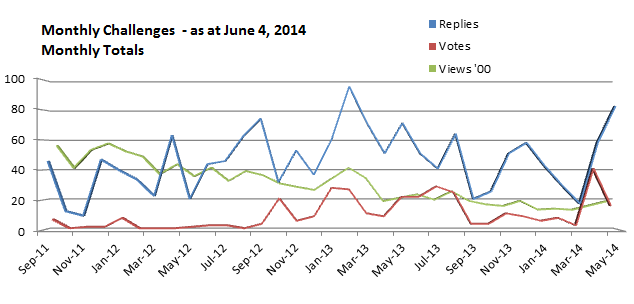
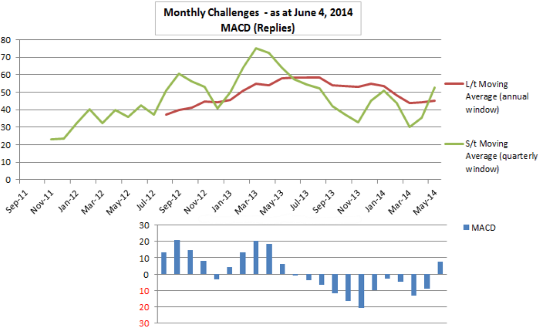
The community has also included some graphical illustration including these two:
Here’s a preview of the Concluding Thoughts published as at June 4, 2014:
Concluding Thoughts
In considering these statistics and trends effort has been made not to view or present them as a community asset but as community-determined service.
The significant statistical observations and interpretations discussed were:
- 1. The possible impact of their innovative conception. Often is the case where something novel takes off then plateaus to a more sustained level of activity.
- 2. The presence of community spirit illustrated by a pattern of oscillation in the MACD graph.
- 3. A recent cross-over of MA’s at least suggesting a coming sustained average and possibly a modest growth trend buoyed by community momentum.
- 4. A forward estimate of current growth to a resistance level of 50 replies.
- 5. Downward sloping “views” line indicating continued interest in all challenges past and present.
It’s also worth considering when projecting, any life-cycle fluctuations that could come about by factors exogenous to the community. These may include things like product innovation, competing products, marketing and goodness knows.
Projections could also be affected by endogenous changes. These may include things like reformatting the challenges, challenge content, incentives, guest posters and any other enhancement conducive to learning and participation.
Looking Ahead
Now that this new project has been setup it seems reasonable to hope for an update of the data collected and its reporting as more data is generated.
Already the community has responded to its own demand in two ways:
- The Projects Conception was marshalled from community questions on the relevance and future of Small Basic; and
- A request to include some data analysis.
So far the package is formatted in an accounting style. The case may come about where members from diverse backgrounds may contribute further analysis perhaps from scientific, mathematical and humanities fields thereby creating a blended array of observation.
To me the Challenges and their traffic reflects an appurtenance of the virtual relationship that is evolving between a corporate giant, individuals from diverse backgrounds and technologies role in optimising mankind’s way forward to better living standards in a climate of significant ecological change.