Analyzing Silverlight Memory Usage: Part 1 – Obtaining Measurements
A View from the Top
So you’ve decided that it’s time to optimize the memory footprint of your Silverlight application. Before you’ll be able to do this analysis and optimization, you’ll need to understand a little bit about the way that Silverlight is structured.
Though the Silverlight programming model that you’ve come to know and love is accessed via managed code, much of Silverlight’s internals are written in native code (C++). The actions that you take in managed code can cause Silverlight to allocate large amounts of native memory on your behalf, be it for layout, rendering, image allocations, you name it.
Especially important to remember is that your managed Silverlight elements will have a native memory counterpart. Reducing the element count in your visual tree will have a direct and favorable impact in native working set. Because of these native allocations, this article will go over analyzing native memory in addition to managed memory.
Where to start?
One of the most intimidating parts of performing memory analysis can be deciding where to start. Often developers don’t focus on memory usage until it becomes a problem, at which point the project has already grown to a rather complex scale. The good news is that there is already a great free tool that can help you divide the problem into more manageable pieces, this tool is VMMap.
VMMap enables you to look inside your process to see both visual and statistical breakdowns of your working set. Once you’ve attached to your Silverlight application you should see three color-coded horizontal bar charts across the top of the window, where each color corresponds to the similarly colored category row in the grid below. You can click each of the column headers in the grid to sort the data in that dimension. Clicking the row for a particular category will filter the per-allocation view at the bottom of the window.
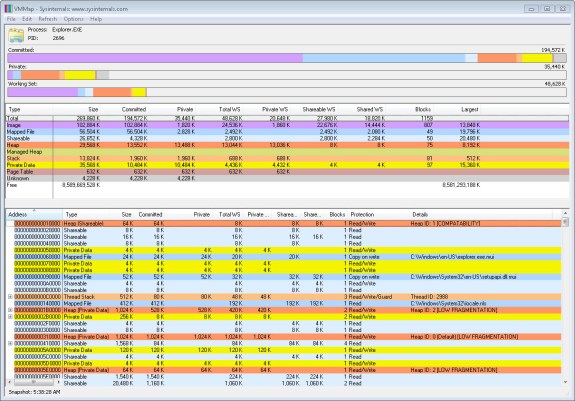
Take a moment to familiarize yourself with the terminology displayed in the window. Even if you think you already understand what each of the categories represents, I recommend you crack open the VMMap help file (via the help menu) and read through the ‘Memory Types’ and ‘The VMMap Window’ nodes. Throughout the rest of this article I’ll be using these definitions as a reference.
Of these terms, ‘Working Set’ is probably the most inconsistently used term in the entire domain of performance analysis. Working set is most accurately defined as “the amount of committed virtual memory that is in physical memory and owned by the process”. Working set can be broken down into three components; these are the private, shareable, and shared components.
Shareable memory is memory that can be shared with other processes, but isn’t necessarily. The most interesting types of shareable memory are generally images (the executable file kind, not the pictographic kind) and mapped files (usually .mui files, or fonts). If your Silverlight application is the first one to start up on the system, then many of your images and mapped files will be loaded under the ‘Shareable WS’ column. If another Silverlight application subsequently starts, these images and mapped files don’t need to be reloaded, so much of this memory will move to the ‘Shared WS’ column as it becomes shared with the other application.
If memory isn’t shareable or shared, it is private. Private memory is memory that can’t be shared with other processes, and is thus private to your application. Since this is the category that application developers have the most control over and impact on, most of this article will be devoted to investigating and understanding process private memory.
Now that you have some background on the terminology of memory analysis, let’s get back to analyzing your application. Click on the ‘Private WS’ column until your private working set is sorted in descending order, now take a look at the largest category. Chances are you are staring at either ‘Heap’ or ‘Managed Heap’. Over the next couple sections, I’ll go over the tools that are available for analyzing that particular type of memory and how you can use them to your advantage.
Tracking Managed Memory
Analyzing managed memory allocations in Silverlight takes a little bit of work as the tools in this space haven’t had a chance to mature yet. At the time of the writing of this article, there are no managed memory profilers available that work with Silverlight. However, Silverlight 4.0 RTM ships with a copy of the Son of Strike (SOS) debugging extension for WinDbg. This will allow you to perform all the SOS actions that you’re already familiar with on the desktop in Silverlight. If you haven’t used the SOS debugging extension before, head over to the MSDN “Investigating Memory Issues” article for a great primer. Though this article is a bit dated, most of the content is still directly applicable to performing managed memory analysis in Silverlight.
There are a few tricks you’ll need to know in order to attach to your Silverlight application using SOS. The MSDN article previously mentioned is written in reference to the desktop CLR, so while reading through the document you’ll need to make a few changes to get things working properly.
- To load SOS, find the SOS.dll in your Silverlight installation directory. Here is an example command for loading SOS on my system, you may need to adjust the path accordingly (notice that back slashes are escaped):
.load "C:\\Program Files (x86)\\Microsoft Silverlight\\4.0.50401.0\\sos.dll" - In the section on ‘Measure Managed Heap Size’, the article mentions setting a breakpoint in mscorwks.dll, the v2.0 desktop CLR. For Silverlight 4.0, the assembly you are looking for is ‘coreclr.dll’. Change the breakpoint from the MSDN article to:
bp coreclr!WKS::GCHeap::RestartEE "j (dwo(coreclr!WKS::GCHeap::GcCondemnedGeneration)==2) 'kb';'g'"
At minimum, there are two SOS commands that you should make sure you are familiar with, these are !DumpHeap and !GCRoot. Both commands are quite aptly named; DumpHeap shows you a dump of the managed heap, and GCRoot finds roots to a particular object.
First let’s take a look at the output from DumpHeap.
0:000> !dumpheap -stat
total 0 objects
Statistics:
MT Count TotalSize Class Name
<snip/>
7b444b64 753 18072 System.Windows.CoreDependencyProperty
79581430 777 18648 System.RuntimeType[]
79584ef4 497 29820 System.Reflection.RuntimeMethodInfo
7958d7ec 3472 55552 System.WeakReference
7956f2d0 1755 80416 System.Int32[]
7b431374 3600 86400 MS.Internal.NativeObjectSafeHandle
79570100 104 98948 System.Byte[]
79571bc0 2282 132128 System.Object[]
79580758 4196 222276 System.String
By default, DumpHeap sorts by total allocation size in ascending order. In this sample you can see that the type responsible for allocating the most memory is System.String over 4196 instances. Looking in the left column you can see the MT value for the System.String type, 79580758. This can be used to retrieve a listing of all allocations on the GC heap of that type, their address, and their size.
0:000> !dumpheap -mt 79580758
Address MT Size
<snip/>
0507f17c 79580758 112
0507f1ec 79580758 128
0507f26c 79580758 24
0507f374 79580758 40
0507f498 79580758 36
050800ac 79580758 60
05080850 79580758 116
total 0 objects
Statistics:
MT Count TotalSize Class Name
79580758 4196 222276 System.String
Total 4196 objects
Now that you have a list of all instances on the heap, you want to find out why they are still alive; for this you can use GCRoot. Simply copy the address (the first column) corresponding to the instance that you’re interested in, then run GCroot.
0:000> !gcroot 050800ac
<snip/>
ESP:30f188:Root: 050807f0(System.ServiceModel.Channels.HttpOutput+WebRequestHttpOutput)->
05080700(System.Net.Browser.BrowserHttpWebRequest)->
05080760(System.Net.WebHeaderCollection)->
050808c4(System.Net.NameValueFromDictionary)->
05080948(System.Collections.Generic.Dictionary`2+Entry[[System.String, mscorlib],[System.Collections.Generic.List`1[[System.String, mscorlib]], mscorlib]][])->
05080a64(System.Collections.Generic.List`1[[System.String, mscorlib]])->
05080a7c(System.Object[])->
050800ac(System.String)
Scan Thread 1 OSTHread 2d28
Scan Thread 5 OSTHread 2f34
Scan Thread 19 OSTHread 1f6c
Scan Thread 21 OSTHread 2cb0
DOMAIN(048AAFE8):HANDLE(Strong):a9117c:Root: 0508083c(System.Threading._TimerCallback)->
05080664(System.ServiceModel.Channels.HttpChannelFactory+HttpRequestChannel+HttpChannelAsyncRequest)->
05080700(System.Net.Browser.BrowserHttpWebRequest)->
05080760(System.Net.WebHeaderCollection)->
050808c4(System.Net.NameValueFromDictionary)->
05080948(System.Collections.Generic.Dictionary`2+Entry[[System.String, mscorlib],[System.Collections.Generic.List`1[[System.String, mscorlib]], mscorlib]][])->
05080a64(System.Collections.Generic.List`1[[System.String, mscorlib]])->
05080a7c(System.Object[])->
050800ac(System.String)
Sometimes just having GC root stack information won’t be enough information for you to understand what’s going on. In these cases it can help to inspect the managed object’s actual fields, this can be achieved using the DO command.
0:000> !do 050800ac
Name: System.String
MethodTable: 79580758
EEClass: 7916205c
Size: 60(0x3c) bytes
File: C:\Program Files (x86)\Microsoft Silverlight\4.0.50401.0\mscorlib.dll
String: text/xml; charset=utf-8
Fields:
MT Field Offset Type VT Attr Value Name
79580e94 40000f1 4 System.Int32 1 instance 23 m_stringLength
795819c4 40000f2 8 System.Char 1 instance 74 m_firstChar
79580758 40000f3 8 System.String 0 shared static Empty
795807e4 40000f4 4e0 System.Boolean 1 shared static _legacyConfigChecked
795807e4 40000f5 4e4 System.Boolean 1 shared static _legacyMode
In this case you can see that the value of the string was text/xml; charset=utf-8.
Given managed heap dumps, GC root stacks, and the ability to inspect individual objects you should have everything that you need to start trimming your managed memory usage. There are plenty of good articles on the web on using the SOS extension in conjunction with WinDbg to optimize your managed memory usage, so I won’t go into more detail here. Instead, in subsequent posts, I’ll focus on Silverlight specific techniques, or scenarios commonly run into while building Silverlight applications.
Future Managed Memory Tools
In Silverlight 4.0 we added the ability to use the CLR v4.0 profiling API in Silverlight. Because of this, third-parties now have the opportunity to write managed memory profilers (or adapt existing ones) to work with Silverlight. As mentioned at the beginning of this section, at the time of writing of this article no profilers are available, but as time goes on I expect we’ll see more and more managed memory profiling tools for Silverlight.
Tracking Native Memory
As I mentioned earlier, much of Silverlight’s internals are written in native code. The actions that you take at the application layer in managed code will cause Silverlight to make native allocations on your behalf for a variety of reasons. Because of this, you should know how to inspect these allocations should an issue arise.
Before we get started, take a look at a VMMap snapshot of your application. Focus on the ‘Heap’ and ‘Private Data’ sections of the snapshot as these will determine where you are seeing a larger amount of allocations. In either case we will use XPerf from the Windows Performance Toolkit for tracking allocations, though the method will be slightly different should you choose to investigate heap or private data.
Native Heap Analysis
So VMMap is reporting that you are holding large amounts of memory on the native heap. The first step in correcting this problem is to collect a heap trace and use the XPerf heap plugin to dissect it. Collecting a heap trace is a little tricky but I’ve written a handy script to ease the process, you can get it here [Download HeapMonitor.zip]. If you’d prefer to control XPerf directly, or if you’d just like more background information, see the “Exploring Process Heaps Using WPA” article on MSDN.
Attaching to Silverlight
- Attaching to an in-browser Silverlight application:
- Launch Internet Explorer with your homepage set to “about:blank”.
- Open an administrative command prompt with XPerf in your path and run:
HeapMonitor.cmd –p <process-id-of-internet-explorer> - Wait for the trace sessions to start, when its ready you should see the text, “Hit enter to stop profiling...”
- Attaching to an out-of-browser Silverlight application.
- Install your Silverlight out-of-browser application on the system and run it.
- Run ‘Process Explorer’ and find the copy of sllauncher.exe associated with your app (you can use ‘right-click => Window => Bring to front’ to help discover which sllauncher.exe process is for your app).
- Right click on that copy of sllauncher.exe and click ‘Properties’, then remember the OOB token that shows up under “Command line”, this token is shown in bold below:
"C:\Program Files (x86)\Microsoft Silverlight\sllauncher.exe" 3800347859.testapp - Open WinDbg and re-launch sllauncher.exe using “File => Open Executable…” passing your OOB token and the /debug flag as command line arguments:
File name: "C:\Program Files (x86)\Microsoft Silverlight\sllauncher.exe"
Arguments: “3800347859.testapp /debug” - Open an administrative command prompt with XPerf in your path and run:
HeapMonitor.cmd –p <process-id-of-sllauncher> - Wait for the trace sessions to start, when its ready you should see the text, “Hit enter to stop profiling…”
- In the WinDbg command window run the “g” command to allow the process to run.
Run Your Scenario
Now that heap tracing is on, use your application as you normally would. Perform any actions that are known to cause the native heap to grow to large sizes in your application so that we can look over them in the trace. Once you are finished reproducing your scenario press enter in the command prompt where you are running the heap trace.
It will take a moment for the trace sessions to be shut down and merged; this can take a long time so you’ll need to be patient. When your trace is ready you’ll see the word “Finished” printed in the command prompt. The line above should tell you the name of your output trace file.
Analyzing Your Heap Trace
Open the output ETL file using XPerf and you’ll see a series of horizontal charts. You can refer back to the XPerf documentation for the details on what each graph displays, this article will only talk about the ‘Heap Outstanding Allocation Size’ graph as shown here.
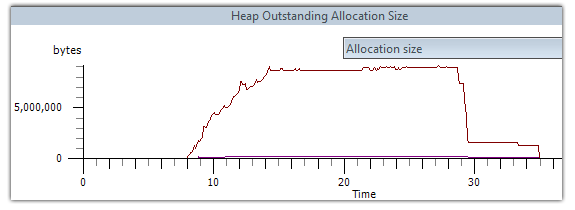
The graph shows the number outstanding bytes allocated over time. You can use the mouse to select a region of the graph, and right click to zoom in or perform other operations. You can use this to select an interesting area of the graph such as a spike in allocation, then right click and select ‘Summary Table’ to get a textual breakdown of heap allocations.
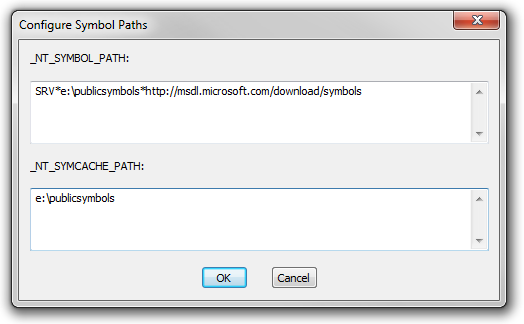
Resolving Symbols
In order to make any of this information useful you’ll need to make sure you’re properly set up to resolve symbols. In XPerf click “Trace => Configure Symbol Paths” and set the following values, adjusting your symbol cache accordingly.
Next, in order to make the most use of XPerf, you’ll want to configure your view in the following way. Arrange your columns from left to right in the same order as shown below, taking care to put the yellow divider in the right location. Columns to the left of the yellow divider are intelligently grouped; columns to the right are not. This configuration is just to get you started, feel free to customize your view once you get more familiar with the tool.
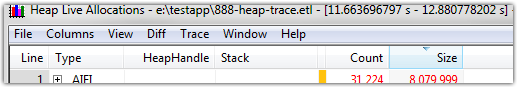
Once you’ve set up your columns, from left to right you have the following:
- Allocation Type. This will be one of the four values below. These categories are relative to your selection on the allocation graph.
- AIFI – (A)llocated (I)nside (F)reed (I)nside
- AIFO – (A)llocated (I)nside (F)reed (O)utside
- Likely the most interesting category, these allocations were created but never freed inside your selection. These have essentially “leaked” from your selection, even though they may be freed later down the line.
- AOFI – (A)llocated (O)utside (F)reed (I)nside
- AOFO – (A)llocated (O)utside (F)reed (O)utside
- HeapHandle – The address of a particular heap.
- Stack – The call stack at which the allocation happened. This hierarchical and can be expanded to drill down to a more specific set of allocations.
- Count – The number of inclusive heap allocations for a particular type, heap handle, and call stack.
- Size – The inclusive size of all allocations in bytes for a particular type, heap handle, and call stack.
Now let’s take a look at an example of a potentially problematic call stack. Here is a seemingly innocuous looking piece of XAML that loads an image from Bing and displays it as a thumbnail at 150x80.
<Image Source="https://www.bing.com/fd/hpk2/Avignon_EN-US2139801834.jpg" Width="150" Height="80" />
Doing the math, we’d expect that this image would take 150x80 x 4 bytes per pixel, or 48kb of memory, no big deal right? Wrong unfortunately. As of Silverlight 4.0 there is no way to set the size at which an image is decoded, they’re always decoded at full size. The actual resolution of the image at that URL was a much larger 956x512, weighing in at 1,961,984 bytes not counting headers. This can be seen in the call stack below:
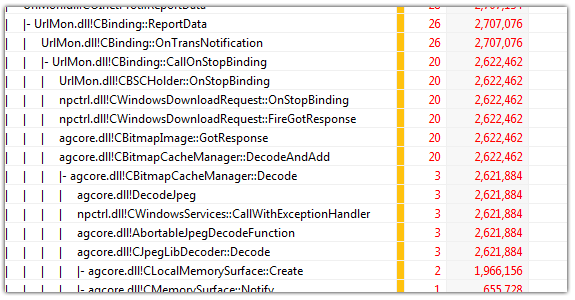
Not all native allocations are this obvious to track back to their design-time source, but oversized image allocations are a common problem we see in customer applications so this is a particularly useful example. To fix this issue, ideally you would explicitly define the DecodePixelWidth/Height for the image; as Silverlight doesn’t support this yet you’ll need to employ a workaround such as this.
Conclusion
Hopefully this article has supplied you with some new and useful information when it comes to gathering data about your Silverlight application's memory usage. These tools and techniques, coupled with your domain knowledge about your application, should prove to be quite a powerful combination for locating suspicious allocations in your application. In subsequent posts on analyzing Silverlight memory usage we will cover some more specific scenarios that build on the foundation techniques in this article.
-Mike Cook