Panels vs. Context: A Tale of Two Visual Studios and a Practical Explanation of the Value of CodeLens
If you have Visual Studio 2013 Ultimate, you know CodeLens is amazing. If you don’t know what CodeLens is, I hope this helps. I have a lot of customers who ask me about CodeLens, what it is, and how valuable I think it is for an organization. Here’s my response.
It’s really a tale of two Visual Studios, if you think about.
A Visual Studio Full of Panels
Let’s say you’re looking at a code file, specifically a method. Your Visual Studio environment may look like this:
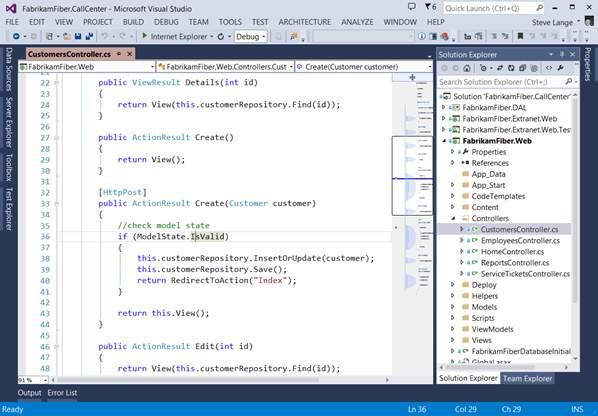
I’m looking at the second Create method (the one that takes a Customer). If I want to know where this method may be referenced, I can “Find All References”, either by selecting it from the context menu, or using Shift + F12. Now I have this:
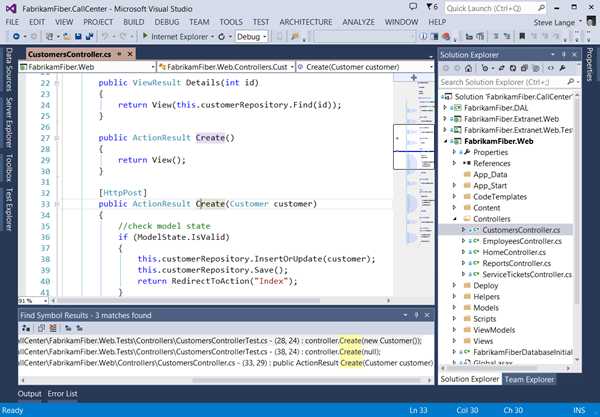
Great! Now, if I decide to change this code, will it will work? Will my tests still work? In order for me to figure that out, I need open my Test Explorer window.
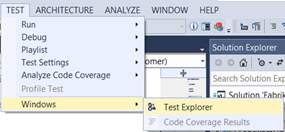
Which gives me a slightly more cluttered VS environment:
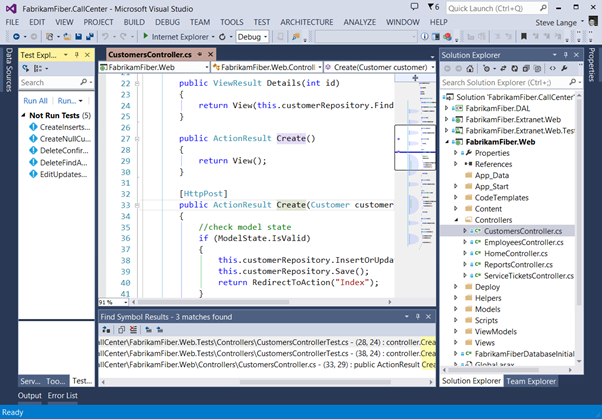
(Now I can see my tests, but I still need to try and identify which tests actually exercise my method.)
Another great point of context to have is knowing if I’m looking at the latest version of my code. I’d hate to make changes to an out-of-date version and grant myself a merge condition. So next I need to see the history of the file.

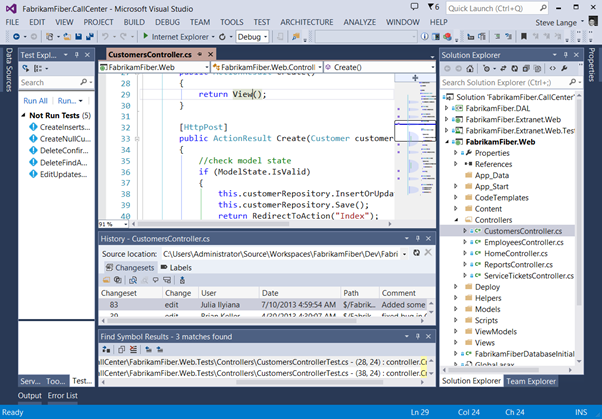
Cluttering my environment even more (because I don’t want to take my eyes of my code, I need to snap it somewhere else), I get this:
Okay, time out.
Yes, this looks pretty cluttered, but I can organize my panels better, right? I can move some panels to a second monitor if I want, right? Right on both counts. By doing so, I can get a multi-faceted view of the code I’m looking at. However, what if I start looking at another method, or another file? The “context” of those other panels don’t follow what I’m doing. Therefore, if I open the EmployeesController.cs file, my “views” are out of sync!
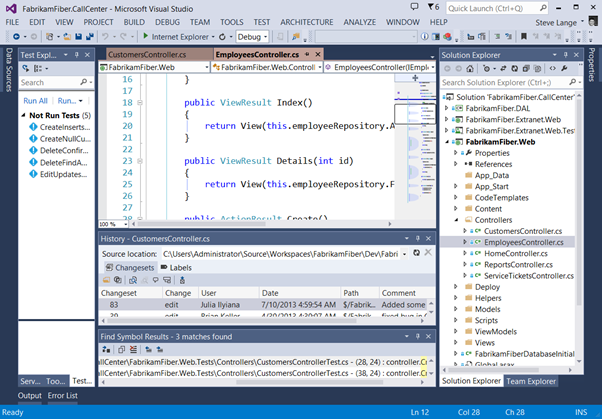
That’s not fun.
A Visual Studio Full of Context
So all of the above illustrates two main benefits of something like CodeLens. CodeLens inserts easy, powerful, at-a-glance context for the code your looking at. If it’s not turned on, do so in Options:
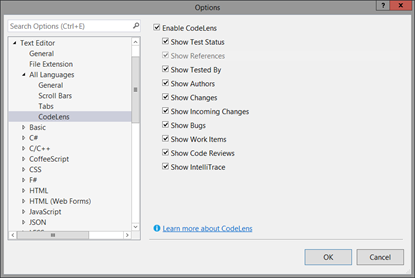
While you’re there, look at all the information it’s going to give you!
Once you’ve enabled CodeLens, let’s reset to the top of our scenario and see what we have:
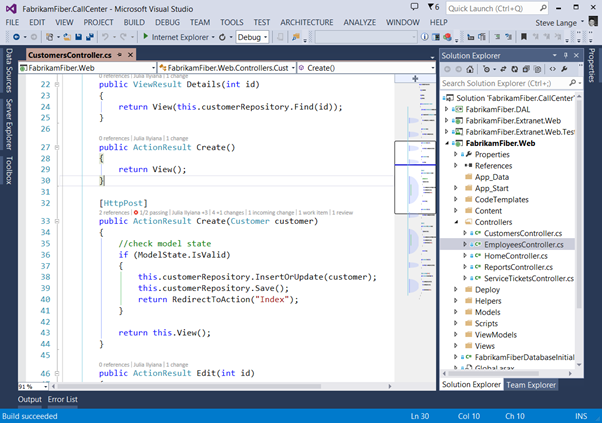
Notice an “overlay” line of text above each method. That’s CodeLens in action. Each piece of information is called a CodeLens Indicator, and provides specific contextual information about the code you’re looking at. Let’s look more closely.

References

References shows you exactly that – references to this method of code. Click on that indicator and you can see and do some terrific things:

It shows you the references to this method, where those references are, and even allows you to display those references on a Code Map:
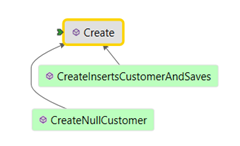
Tests

As you can imagine, this shows you tests for this method. This is extremely helpful in understanding the viability of a code change. This indicator lets you view the tests for this method, interrogate them, as well as run them.

As an example, if I double-click the failing test, it will open the test for me. In that file, CodeLens will inform me of the error:

Dramatic pause: This CodeLens indicator is tremendously valuable in a TDD (Test Driven Development). Imagine sitting your test file and code file side-by-side, turning on “Run Tests After Build”, and using the CodeLens indicator to get immediate feedback about your progress.
Authors

This indicator gives you very similar information as the next one, but list the authors of this method for at-a-glance context. Note that the latest author is the one noted in the CodeLens overlay. Clicking on this indicator provides several options, which I’ll explain in the next section.

Changes

The Changes indicator tells you information about the history of the file at it exists in TFS, specifically Changesets. First, the overlay tells you how many recent changes there are to this method in the current working branch. Second, if you click on the indicator you’ll see there are several valuable actions you can take right from that context:

What are we looking at?
- Recent check-in history of the file, including Changeset ID, Branch, Changeset comments, Changeset author, and Date/time.
- Status of my file compared to history (notice the blue “Local Version” tag telling me that my code is 1 version behind current).
- Branch icons tell me where each change came from (current/parent/child/peer branch, farther branch, or merge from parent/child/unrelated (baseless)).
Right-clicking on a version of the file gives you additional options:
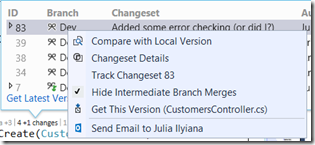
- I can compare my working/local version against the selected version
- I can open the full details of the Changeset
- I can track the Changeset visually
- I can get a specific version of the file
- I can even email the author of that version of the file
- (Not shown) If I’m using Lync, I can also collaborate with the author via IM, video, etc.
This is a heck of a lot easier way to understand the churn or velocity of this code.
Incoming Changes

The Incoming Changes indicator was added in 2013 Update 2, and gives you a heads up about changes occurring in other branches by other developers. Clicking on it gives you information like:

Selecting the Changeset gives you the same options as the Authors and Changes indicators.
This indicator has a strong moral for anyone who’s ever been burned by having to merge a bunch of stuff as part of a forward or reverse integration exercise: If you see an incoming change, check in first!
Work Items (Bugs, Work Items, Code Reviews)

I’m lumping these last indicators together because they are effectively filtered views of the same larger content: work items. Each of these indicators give you information about work items linked to the code in TFS.


Knowing if/when there were code reviews performed, tasks or bugs linked, etc., provides fantastic insight about how the code came to be. It answers the “how” and “why” of the code’s current incarnation.
A couple final notes:
- The indicators are cached so they don’t put unnecessary load on your machine. As such they are scheduled to refresh at specific intervals. If you don’t want to wait, you can refresh the indicators yourself by right-clicking the indicators and choosing “Refresh CodeLens Team Indicators”

- There is an additional CodeLens indicator in the Visual Studio Gallery – the Code Health Indicator. It gives method maintainability numbers so you can see how your changes are affecting the overall maintainability of your code.
- You can dock the CodeLens indicators as well – just know that if they dock, they act like other panels and will be static. This means you’ll have to refresh them manually (this probably applies most to the References indicator).
- If you want to adjust the font colors and sizes (perhaps to save screen real estate), you can do so in Tools –> Options –> Fonts and Colors. Choose “Show settings for” and set it to “CodeLens”.
I hope you find this helpful!