Correlating Retail Store Sales with Demographic Data
Retailers are facing growing challenges extracting business value from their data. The growth of data continues, due to new devices and sensors and rapidly declining hardware cost. Data complexity is increasing as retailers handle both structured data and unstructured data.
Microsoft’s vision is to provide business insights to all users from any data, including insights previously hidden in unstructured data. Microsoft provides a range of solutions to help customers address big data challenges.
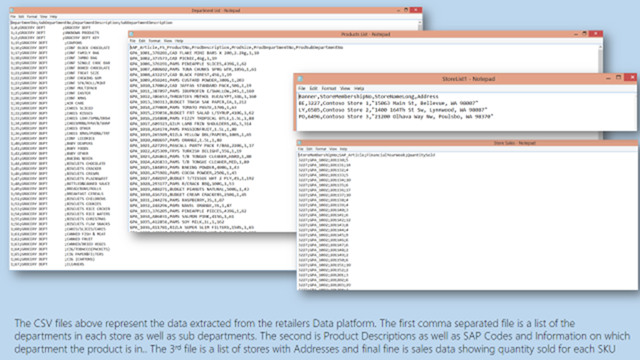
 One of the challenges that Retailers face is in enabling business users to better understand store performance reports. One of retailers that I worked with had reports being generated using a legacy system. The report showed rows with store numbers and product SKU’s. They wanted to make the reports easier to read by correlating the store numbers to actual store names and the SKUs to product descriptions. In addition, they were also seeking a tool with which they could better visualize and interact with the data. For this particular business challenge, we decided to use the capabilities within Excel to pull in data from the various sources and establish the connections.
Microsoft PowerPivot for Excel 2013 is a built-in add-in that you can use to perform powerful data analysis bringing self-service business intelligence to your desktop. PowerPivot is a powerful data mashup and data exploration tool based on xVelocity in-memory technologies providing unmatched analytical performance to process billions of rows.
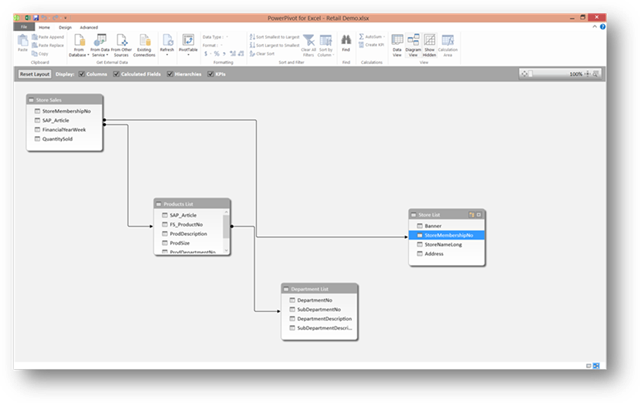
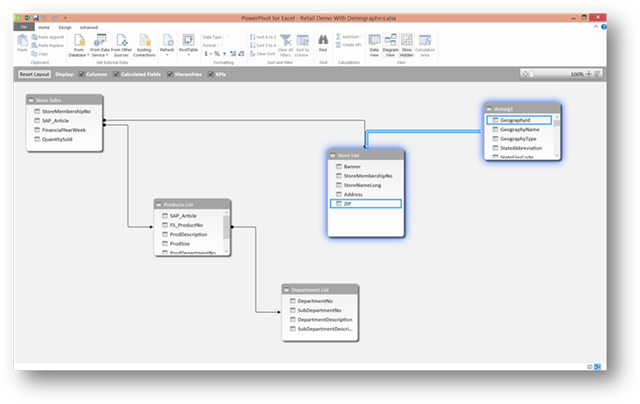
I used the PowerPivot Table Import wizard in Excel to import the data tables. PowerPivot can import data from a variety of relational sources: Access, Oracle, Sybase, Informix, DB2, Teradata, and more. To enable the Store Names and Product Descriptions to be displayed in the report, I established relationships between the various tables using the Diagram View.
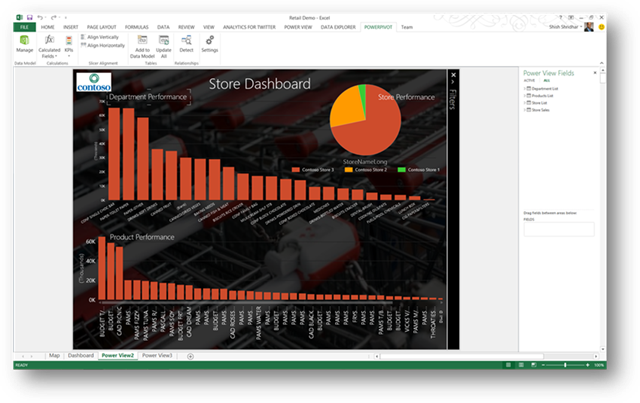
 The next step was to build out the visualizations that would enable us to view the performance of the stores and products as charts. Power View, which is part of Excel 2013, is an interactive data exploration, visualization, and presentation experience that encourages intuitive ad-hoc reporting.

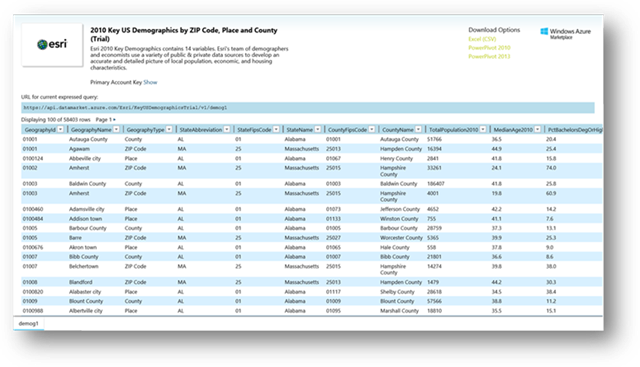
The visualizations showed me significant differences in sales performance between the three retail stores for which I had the data. Retail sales are impacted by various factors that include weather, trends and demographics of the people around the store location. Correlating the sales data with demographics, weather or social media buzz would give us additional insights into what factors could be impacting the sales in the three stores. Since the store locations were all within Washington State, I made the assumption that weather and trend wouldn’t be significantly different between the stores. This left demographics as possible choice. The Windows Azure™ Marketplace is an online market for buying and selling finished Software as a Service (SaaS) applications and premium datasets. I searched the Windows Azure Marketplace for a suitable dataset and found one from Esri.

The data from Esri had interesting demographic data for each zip code within the US for 14 key demographic variables. The information included median age, total population, Per Capita Income, Median Home Value, Percentage having Bachelors Degree or higher, Unemployment rate and so on. This rich data set would enable me to compare and correlate the sales for the stores with these demographic indicators.
 I used the PowerPivot Table Import Wizard in Excel to import the demographic data. Once the data was imported, I used the Diagram View to establish the relationship between the demographic data and the store table using the zip code as the key.

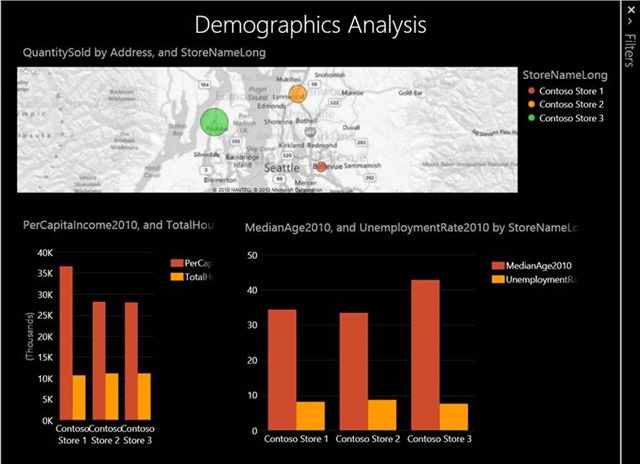
I now had the capability to create Power View visualizations to find correlations of the retail store sales to demographic indicators.

Looking at the data I notice that the worst performing store happened to have the highest per capita income whereas the better performing stores had a lower per capita income in the area. To understand this further, I added median age to the visualization. Adding this data showed me that the median age of the people around the best performing store was the highest. These insights can give us indicators of what changes to make to the stores based on the key demographics.
Exploring relationships between retail store sales and external data sources like demographics, weather and social data can provide powerful insights to retailers.