XCelsius + Excel + MOSS 2007
 Over the last few days, I was experimenting with ways to create a snazzy looking dashboard using MOSS 2007. Among the various options, I found a pretty cool option using XCelsius (Thanks Will, for the pointer). I downloaded the trial version to see how good it was and was pretty amazed with the quality of the data visualization. To test it out, I used Excel 2007, connected to backend SQL Data, and pulled in some sales data. I then used XCelsius and generated a swf file that I posted to a Sharepoint document library. To display this in Sharepoint, I used a content editor webpart and used the following code that I gleaned from Henrik Lovgret :
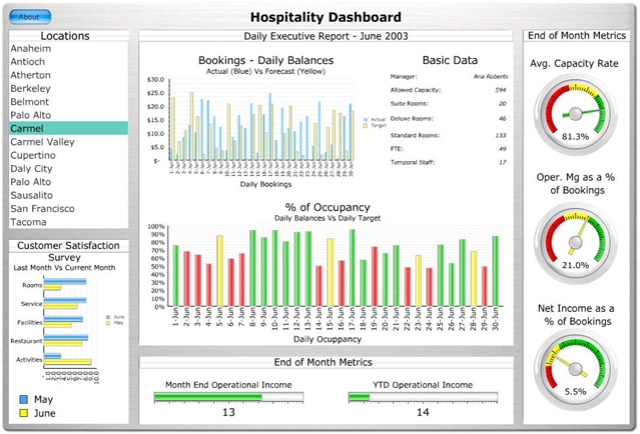
<object classid="clsid:d27cdb6e-ae6d-11cf-96b8-444553540000" codebase="https://download.macromedia.com/pub/shockwave/cabs/flash/swflash.cab#version=6,0,0,0" width="202" height="93" id="worldtime" align="middle">
<param name="allowScriptAccess" value="sameDomain" />
<param name="movie" value="https://your_domain/flashfile.swf" />
<param name="quality" value="high" />
<param name="bgcolor" value="#ffffff" />
<embed src="https://your_domain/flashfile.swf" quality="high" bgcolor="#ffffff" width="202" height="93" name="worldtime" align="middle" allowScriptAccess="sameDomain" type="application/x-shockwave-flash" pluginspage="https://www.macromedia.com/go/getflashplayer" />
</object>