An Introduction to Conditional Formatting
 Hi everyone, Jon here again. Today I wanted to show you how to use Conditional Formatting to really spice up your data views.
Preparation
The customizations that I am going to demonstrate revolve around the creation of a product ordering page. To start, I created a SharePoint list called Products to store my data, though you could just as easily hook up into a database or other data source. I created the following fields:
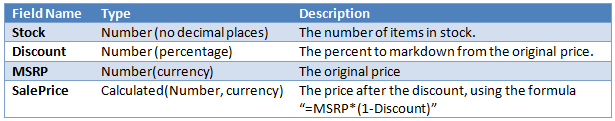
I then filled in the table to have some sample values. If you are using your own datasource, be aware that the field names will be different, but the concepts will remain true. When doing conditional formatting, the biggest pre-requisite is that you need to be using a data view to display your data. There are a couple ways to create a data view, so if you haven’t done it before I suggest checking out the documentation on Microsoft Office Online.
 Show/Hide
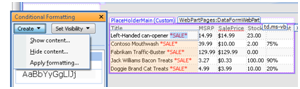
One of the easiest ways you can use conditional formatting is to show or hide something in your data view based on some condition. In the case of the above table, we might want to show *SALE* next to any item that has a discount associated with it. The first thing you will want to do is insert whatever it is you want to show or hide. Next, right click in your data view and select Conditional Formatting… to bring up the Conditional Formatting task pane. Highlight the text you want to hide (*SALE* in our case), then click the Create button in the conditional formatting task pane. Select the Hide Content… option, which will bring up a dialog for setting your criteria. Since the Discount field can be zero or empty, make the condition be “Discount Is Null OR Discount Equals ‘0’ ”. You can now save the page and view the results in your browser.
Advanced Show/Hide
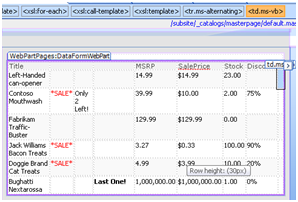
Now that we have the basics of creating a condition down, we can add something a little more interesting. On many ecommerce sites you will see text on certain items indicating “Only 5 Left!” or “Last One!” in the listing. Creating the text for “Last One!” is the same as what we did for sale – insert your text, highlight it, then click the Create button. Instead of selecting Hide, select Show since most of the time there will be more than one item. For the condition choose “Stock Equals 1”. To create the “Only 5 Left!” insert the text, then drag the Stock field from the Data Source Details task pane and drop it next to the number 5. Once you delete the 5, you now can select the text and repeat the same steps for the Show option, but choose “Stock Less Than 10 AND Stock Greater Than 1”. The reason we have the second clause is that we don’t want to show the text when we are already showing the “Last One!” text, nor do we want to show it for items that are out of stock.
KPIs and Icon Sets using "Apply Formatting"
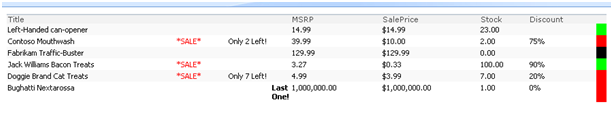
SharePoint Designer 2007 doesn’t have the same icon sets features that you get with Excel 2007, but you can achieve the same results using conditional formatting. To make space for our KPI, right click in the right most column of the table, select Insert -> Column to the Right. Using the quick tag selector, choose the <td> tag. In the Conditional Formatting task pane, select Create ->Apply Formatting…. For the condition, select “Stock Greater Than 20” and click ok. You will then be presented with the modify style dialog. Here you can change just about any style aspect you choose, but for now select Background for the category and then set the Background Color to be green.
 Repeat the same steps three more times: first with the condition “Stock Less than or Equal to 20 and Stock Greater than 10” with the background color yellow, then with the condition “Stock Less than or Equal to 10 and Stock Greater Than 0” with the background color red, and finally with the condition “Stock Equals 0” and the background color black.
The reason we had to use both the “less than or equal to” condition and the “Greater than” condition is that each rule is interpreted independently. Because of that, if we didn’t select “less than or equal to” for the second condition then an item that had 50 items in stock would match both the first and second conditions (since it is greater than 20 and greater than 10). Be careful of this when selecting your condition criteria.
You can use the same technique with images (such as a set of up, down, and sideways arrow icons) by using the Show and Hide options as appropriate.
Conditional Formatting - Under the Covers
I won’t get into the intricate details of XSLT here, but it is useful to know that the way that SharePoint Designer 2007 implements conditional formatting is by wrapping your element with an <xsl:if> clause. The Show option is essentially a clause that says <xsl:if test=”your condition”>your markup</xsl:if>. When the condition is true, your markup shows up in the page. The Hide option is basically the same, but with your condition surrounded by “not()”. You can use the same concepts to create very advanced formatting options by hand if you choose, or use the Advanced… button in the Condition Criteria dialog to use SharePoint Designer’s XPath Expression builder to build your condition.
I hope you find some of this useful – conditional formatting is extremely powerful.
Enjoy!