SP2013: Using Get-SPIndexReports to Troubleshoot Failed Master Merge
Ever had an SP2013 Index Component report a yellow exclamation point ( ) to indicate a "degraded index component" and then wondered what that really meant? From my experience, these almost always either tied to an underlying disk problem and/or some external software interfering with the component (most commonly, AntiVirus or file-level backup utilities).
In this post, we'll specifically look at a failed Master Merge using Get-SRxIndexReports cmdlet introduced with our Search Health Reports (SRx) Core diagnostic tools, which can be downloaded from the TechNet Gallery here .
Note: the script I originally referenced in this post can still be downloaded, but has been deprecated by the SRx
the Get-SPIndexReports script introduced in my previous blog post here to highlight the warning signs… and then show new functionality extend the script to better accommodate this case.
The Background and Scenario
For this scenario, the deployment of the Search Service Application (SSA) entailed two Index partitions, each with two replicas – a configuration commonly called a 2-by-2. And to keep things simple, assume each of the four Index components each run on a separate server.
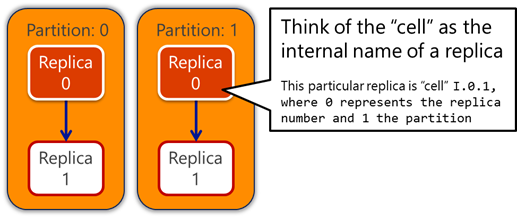
| As a side note and reminder, I provided more details around the concepts of Index Components, Replicas, and Cells in the first post. Loosely speaking, you can interchangeably use the term Replica and Cell to refer to a particular instantiation (e.g. replica) of a segment (e.g. partition) in the Search Index.To me, the Cell naming convention provides more detailed specificity (for example, the replica ID and the partition number as in I.[ replica# ].[ partition# ] ) and is commonly found in log messages throughout ULS/PowerShell…. So I prefer to refer to the Cell. |
When the customer first engaged me for assistance, they were reporting the following symptoms:
- Disk storage on one of the Index components continued to increase over several days without relief and had grown much larger than the other Indexers in terms of disk storage utilization.
- A different Index component continually showed the yellow exclamation point in the Search topology web part (e.g. in the Search Admin page from Central Admin).
Verifying the Behavior
As recommended in my previous post, we first started with the Get-SPSearchTopologyState.ps1 script (the original version here and my extended version here) to ensure a baseline level of health and to verify that no other underlying issues existed (and thus should be resolved first). In this case, the output was clean, so we proceeded to running the Get-SPIndexReports script (with the detailed flag).
In the first part of the output, we found the following, which provided a lot of clues (highlighting added for emphasis):
Host State Name CellName Partition
---- ----- ---- -------- ---------
Primary Generation ActiveDocs Merging CheckpointSize
------- ---------- ---------- ------- --------------
INDEX-SRV-A Active IndexComponent3 [I.0.0] 0
True 473563 8563928 False 172976.3 (MB)
INDEX-SRV-B Active IndexComponent5 [I.1.0] 0
False 473563 8563928 False 172185.2 (MB)
INDEX-SRV-C Degraded IndexComponent2 [I.0.1] 1
0 0 False (MB)
INDEX-SRV-D Active IndexComponent4 [I.1.1] 1 True 473563 8562280 True 479232.2 (MB)
On the first two rows of this output, we see the two replicas for Partition 0 (cells [I.0.0] and [I.1.0]) where both have an Active state, reference a consistent Generation 473563, and report a similar CheckpointSize at ~170 GB.
On the bottom two rows, we see the two replicas for Partition 1 (cells [I.0.1] and [I.1.1]) where:
- Cell [I.0.1] is Degraded
- And Cell [I.1.1], the primary replica for this partition, is Active and has a consistent Generation 473563 to the cells in the other partition
- However, this cell has a significantly larger CheckpointSize at ~480 GB
Further in the report, we then find the actual size of the Index files on disk…
ServerName Name Path Size on Disk
---------- ---- ---- -------------
INDEX-SRV-A IndexComponent3 F:\Index 173519.7 (MB)
INDEX-SRV-B IndexComponent5 F:\Index 172797.7 (MB)
INDEX-SRV-C IndexComponent2 F:\Index 111254 (MB)
INDEX-SRV-D IndexComponent4 F:\Index 479545.1 (MB)
…which corresponds with the CheckpointSize listed earlier in the report and correlates with the behavior reported by the customer.
A Glimpse into the Mechanics for Managing the Index
In the Search System, the Journal is conceptually analogous to a DBMS transaction log in that it tracks the sequential history of all operations submitted to an index cell (e.g. adding or deleting items from the Index). A replica with a transient failure can use the Journal to re-play a set of operations and recover to a consistent state.
The Generation ID is conceptually analogous to the transaction log sequence number (LSN) in SQL Server. It is sequentially ordered such that Generation [N] refers to operations that occurred more recently than those associated with Generation [N-1] . Simplistically speaking, think of a Generation as a high water mark for content being submitted into the Index. The Search System has only one "open" Generation at any time, and the Search Admin component manages the starting/closing of a Generation.
The Generation ID is used by various components across the SSA for coordination. For example, each Index replica [cells] reports its current Generation to the ClusterManager thread running in the Search Admin and from this, the Search Admin determines the "in sync" (or "left behind") status for a given replica [cell]. The GenerationController thread in the Search Admin determines the newest Generation common to all available replicas and then notifies each Query Processing Component with that Generation to synchronize which content can be queried (i.e. the Generation is supplied by the QPC when submitting a query to the Index replicas).
During a crawl, items are gathered by the Crawler, fed to the Content Processing Components, and then submitted to the Index:
- The CPCs submit content only to the primary replica [cell] for each Index partition
- A "content group" is a set of documents submitted by a CPC to the Index as an atomic operation
- A "generation" is a set of content groups submitted to the Index around the same time by any/all of the CPCs
- The Index replica [cell] first writes content to the Append Section of the Journal
- When the Generation is Committed, it is persisted from memory to disk in the Journal
- Should a power outage occur here, the documents in this generation could be recovered by replaying the Journal
- The primary replica keeps all secondary replicas for the same partition in sync by shipping the Journal containing the operations for the Generation; the secondary replicas then receive and re-play the operations from the Journal
- The primary replica of each partition has the JournalShipper thread running, whereas the other replicas in that partition instead have the JournalReceiver thread
- With Journal shipping, it is possible for the primary replica to have a slightly higher Generation than the secondary replicas in the same partition
- Once the Append Section of the Journal reaches a threshold, it gets closed becoming a read-only Checkpoint Section ... and a new Append Section gets opened
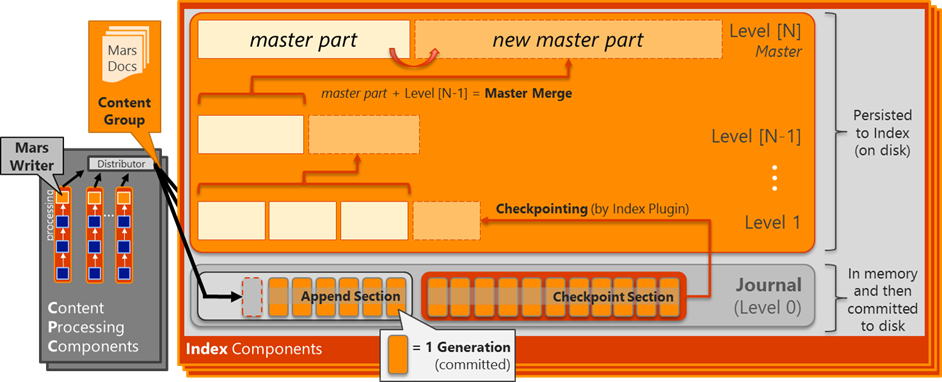
As illustrated above, the Index files are physically structured in levels with a "master" index part file on top representing the vast majority of items in the Index and zero or more sub-levels (sometimes called the "Shadow Indexes") containing recent changes (the Journal is considered "Level 0"). The Index Plugin thread in the Index Component is responsible for "Checkpointing", the process of persisting the Checkpoint Sections from the Journal into the Index and the result is a new Index "part" file.
Also, Index files are never directly modified. Instead, when the Index parts on one level become >10% of the level above, they are "merged" into a new part file at that next level above. After the merging has completed, the parts on the lower levels (now merged into the higher level) can then be deleted from disk. During normal operation, the master part typically accounts for >90% of the active documents in the given partition (100% when everything is fully merged into the master part) and the levels below for the other ~10%.
Every 15 minutes, the Application Server Administration Services timer job running on the Primary Search Admin server triggers a check for each replica that compares this ratio of items in the master part versus parts in levels below. If greater than 10% exists in the lower levels, a Master Merge begins for that replica resulting in a new master part file. This has a few key implications:
- Because the merging process can be a resource intensive operation, expect impacts to both IOPS and CPU and benchmark architectures accordingly
- Because Index parts are created/merged independently by each replica [cell], "in sync" replicas [cells] within a partition should have the same logical content across the replicas, but they may have different physical index parts on the file system until a master merge occurs
- Because Index parts are not updated and instead effectively replaced by a new version, the new master part file may be the size of the original master part plus the sum of all the parts in the lower levels
- Remembering that the original master part would not be deleted until after the Master Merge completed, this means that the physical index path may temporarily consume twice its size
Troubleshooting the Root Cause
Assuming a heathy SSA and all replicas had been updated to the same Generation, we would generally expect all replicas across all partitions to have a similarly sized footprint. More specifically, assuming all replicas had recently completed a Master Merge and no content is currently being submitted or deleted to/from the Index, all replicas would typically report a similar number of active documents and similar checkpoint size, which corresponded with the physical size of the files on disk.
In the reports described above, we see this consistency for the two replicas for Partition 0 (cells [I.0.0] and [I.1.0]) with 8563928 ActiveDocs as well as ~170GB for both the CheckpointSize and actual size on disk. Although cell [I.1.1] from Partition 1 reports a consistent number of ActiveDocs (8562280), the CheckpointSize and actual size on disk, at ~480GB, are almost three times the size of the replicas [cells] in Partition 0.
We also see that cell [I.1.1] (IndexComponent4 running on INDEX-SRV-D) reports "Merging = True". Given that the size had not reduced after several days (which should be more than enough time for the Master Merge to complete), we immediately suspected that the Master Merge had been running (and continually failing) for this entire time.
As described above, the Master Merge can require twice as much disk space than currently utilized – in this case, that could mean another ~500GB of free space needed to allow the Master Merge to complete. To confirm, we ran the following for the F:\ drive on the INDEX-SRV-D server:
get-WmiObject win32_logicaldisk -Computername INDEX-SRV-D | ? {$_.DeviceID -match "F"}
Which generated a report such as:
DeviceID : F:
DriveType : 3
ProviderName :
FreeSpace : 64315850752 /* only ~64GB free */
Size : 524421359616
Because the drive did not have sufficient space, one or more of the errors such as the following would get reported in the ULS logs:
[Event AJ3TW]
A master merge has been halted for catalog F:\Index\SP4c93e7a037ce.2.I.1.1\ms\%default due to low disk space. As a result query latency will be adversely affected. Free some disk space on the disk drive hosting the catalog to allow the next master merge to complete
[Event AJ3TV]
A shadow merge has been halted for catalog F:\Index\SP4c93e7a037ce.2.I.1.1\ms\%default due to critically low disk space. As a result query latency will be adversely affected and ultimately indexing of new content blocked. Free disk space on the disk drive hosting the catalog to allow merges to complete.
[Event AJ3TU]
Checkpointing new content to catalog F:\Index\SP4c93e7a037ce.2.I.1.1\ms\%default failed due to critically low disk space. No new content will be indexed until disk space has been freed on the disk drive hosting the catalog.
Although not the case here, I have also seen merge failures occurring for reasons other than insufficient disk space, but those tend to be very scenario specific (e.g. where files are being locked by AV). Being said, for those cases, you can still look for failures during the merge such as the following and troubleshoot them accordingly:
[Event AIE8G]
INFO : fsplugin: IndexComponent4-18b876c5-d049-4031-bdde-a5355e597dd0-SP4c93e7a037ce.2.I.1.1 (15148): Unable to open file: &F:\Index\SP4c93e7a037ce.2.I.1.1\ms\%default\part.00000a6f\merged.mfs|/SpTermsIdx/all/posocc.ccnt
[Event AIE8G]
Unexpected: ERROR : fsplugin: - (4380): merge for %default failed
The Resolution
In this scenario, the customer then extended the drive to 1TB allowing the Master Merge to complete for cell [I.1.1]. Upon completion, the CheckpointSize and actual size for this cell also corresponded with cells [I.0.0] and [I.1.0] from Partition 1.
-----------------
Up to this point, we have largely and intentionally ignored the Degraded cell [I.0.1] (IndexComponent2 on server INDEX-SRV-C) because it merely was not the primary replica for Partition 1. As described above, the primary replica keeps all secondary replicas for the same partition in sync through Journal shipping. If a secondary replica cannot keep up for whatever reason (the most common culprit being Antivirus or some other underlying disk issue), the secondary replica is "left behind" and re-seeded ("seeding" is the process of copying over all of the index files in addition to the Journal files).
Being said, if a problem exist with the primary replica, it's almost always best to start troubleshooting the primary replica first to get things resolved there before moving onto the secondary replicas (that have a dependency of sorts on the primary). And, if a problem occurs with the primary replica (e.g. the world opens up and swallows that server), then the Search Admin component can elect a new primary replica from the partition.
At the end of the initial report detailed above, we also found the following seemingly cryptic, but very informative reports (Note: I highlighted the cells consistently with any highlighting above using purple for cells in Partition 0 and orange/red for cells from Partition 1 )
Health Reports for Index System SP4c93e7a037ce of Constellation 79FA01:
Name Message Level
---- ------- -----
active_indexrouters[SP4c93e7a037ce] [I.0.0, I.1.1] Info
in_sync[SP4c93e7a037ce.0] [I.0.0, I.1.0] Info
in_sync[SP4c93e7a037ce.1] [I.1.1] Error
left_behind[SP4c93e7a037ce.0] [] Info
left_behind[SP4c93e7a037ce.1] [I.0.1] Warning
members[SP4c93e7a037ce.0] [I.1.0, I.0.0] Info
members[SP4c93e7a037ce.1] [I.1.1, I.0.1] Info
primary[SP4c93e7a037ce.0] I.0.0 Info
primary[SP4c93e7a037ce.1] I.1.1 Info
seeding[SP4c93e7a037ce.1] [I.0.1] Warning
Notice that most of the row names are essentially duplicated except for the trailing ".0" or ".1" in the report names (such as in_sync[SP4c93e7a037ce.0] versus in_sync[SP4c93e7a037ce.1]). In a nutshell, you should typically expect to see a report of each type times the number of Index partitions. For example, assuming the SSA had 25 partitions, you would see 25 rows labeled from ".0" to ".1" and up to".24" each listing the in_sync Cell names for that given partition (and so on for the left_behind, members, and primary reports, too).
In this case, fixing the primary Cell I.1.1 also allowed the seeding and subsequent Journal feeding from Cell I.1.1 to Cell I.0.1 to succeed… and thus, the Cell I.0.1 then also successfully transitioned from Degraded to Active.
Running the report again, we now see:
Host State Name CellName Partition ---- ----- ---- -------- ---------
Primary Generation ActiveDocs Merging CheckpointSize
------- ---------- ---------- ------- --------------
INDEX-SRV-A Active IndexComponent3 [I.0.0] 0 True 473563 8563928 False 172976.3 (MB)
INDEX-SRV-B Active IndexComponent5 [I.1.0] 0 False 473563 8563928 False 172185.2 (MB)
INDEX-SRV-C Active IndexComponent2 [I.0.1] 1 False 473563 8562280 False 173332.2 (MB)
INDEX-SRV-D Active IndexComponent4 [I.1.1] 1 True 473563 8562280 False 172579.6 (MB)
Extending the Get-SPIndexReports script
On more than one occasion, I have need to separately run the "get-WmiObject win32_logicaldisk" manually to determine the FreeSpace on a given drive…. So now, that has been incorporated into the report as seen below:
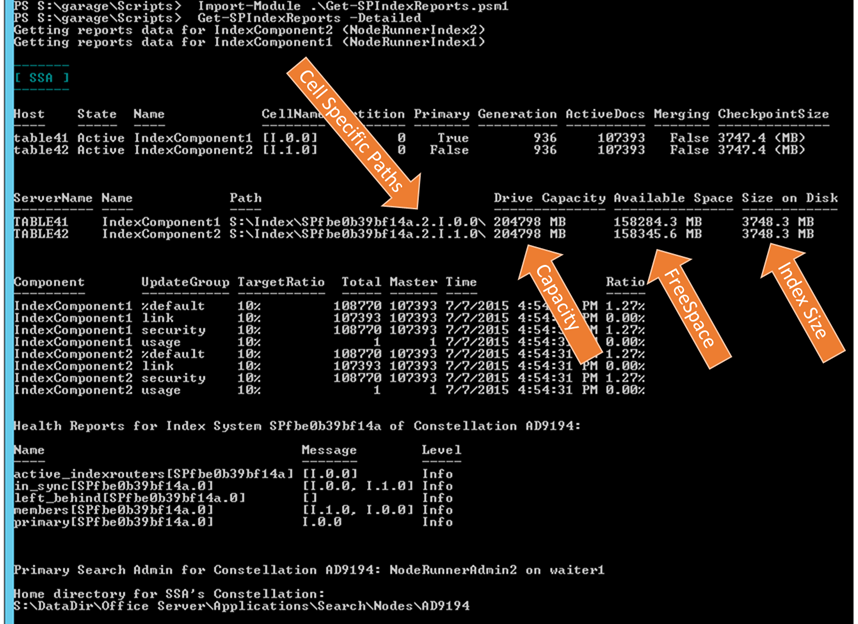
Also, in the original script, thanks to Kris Loranger, we found that the "Size on Disk" value could be skewed for servers with multiple Index paths all sharing the same RootDirectory value. In that case, the size being reported here was actually the sum of all replicas rather than just that single replica. By using the cell specific path (as seen here), this has since been fixed.
---------------
As I add more functionality or find more use cases, I will continue to post about them.
I hope this helps...