SP2013 Search Index health reports for monitoring and troubleshooting
Update:
The newest version of the Search Index Health Reports script can now be found with our Search Health Reports (SRx) Core diagnostic tools, which can be downloaded from the TechNet Gallery here .
----------
Ever had an SP2013 Index Component report a yellow exclamation point ( ) to indicate a "degraded index component" and then wondered what that really meant? From my experience, these almost always either tied to an underlying disk problem and/or some external software interfering with the component (most commonly, AntiVirus or file-level backup utilities). In this post, we'll discuss some tools to monitor and troubleshoot these degraded Index Components and help better explain the problem at hand.
Step 1: Go Beyond Looking for Green Checkmarks
When this occurs, I first recommend using this incredibly useful "topology" script written by a member of our Product Group to give you more details on any degraded component and key information about the Search System overall. Then, in addition to this topology script, try running the following PowerShell module that I posted in the TechNet Script Center (some examples are detailed below)
The core of this module is based on this post "Monitoring an SSA's Index" by Dan Pandre, to which he described:
"The Search Administration Component is responsible for managing both the overall topology of the search system and the search index states… The script below combines these reports into a single summary that can be used to check the overall status of an SSA's search index and interpret ULS log events relating to that search index. "
And with that… examples.
Example 1: The Index and a large Full Crawl
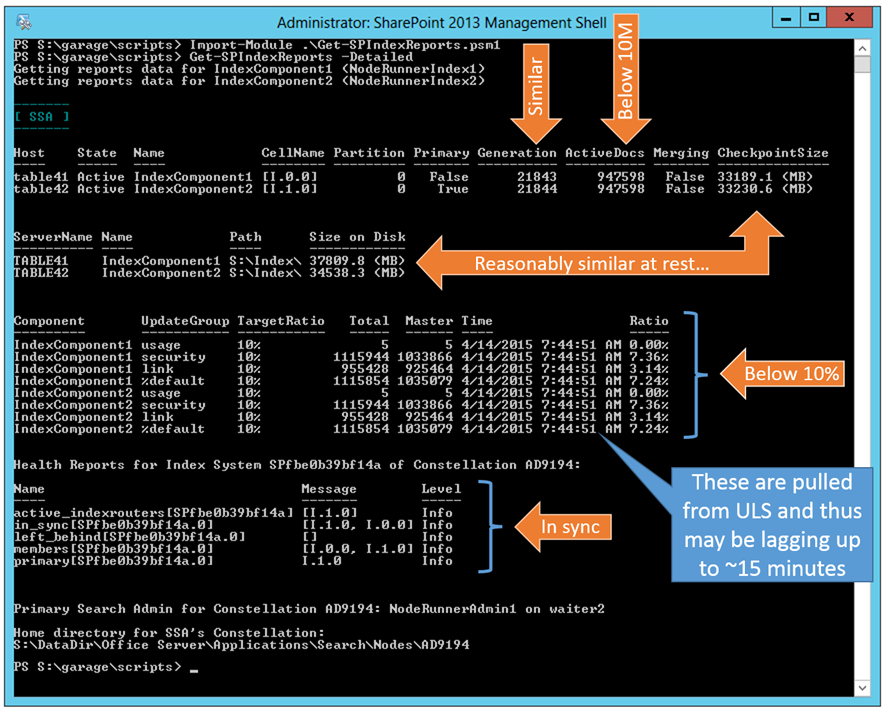
First, we see a scenario where the system is healthy with all components are "Active" and "In Sync" with very similar generations (think of a generation as the high water mark of content submitted to this component). We can also see (by leveraging Merge-SPLogFile) the ratio for each Update Group in a replica that gets used to calculate whether a Master Merge needs to occur.
Notes:
- This Master Merge Trigger check gets performed by the Application Server Administration Services timer job on the Primary Admin Component
- A given Index Component manages a given Index Cell ...the first output helps you map one to the other (e.g. IndexComponent1 => Cell [I.0.0] )
- Often in the ULS logs and PowerShell reports, you will see a Cell name (e.g. [I.0.0]) referenced instead of the "Index Component" nomenclature
- Loosely speaking, you can refer to these interchangeably – but it's worth noting that there is no correlation between the Index Component number (in this case, Index Component 1 and 2) with the Cell names
- A Cell represents a logical segmentation of the index whereas the Index Component represents the physical implementation
- The naming convention for a Cell is I.[replica number].[partition number]
- All replicas in a given partition will have the same trailing number
- In this case with one partition, notice both replicas end with "0", which ties back to Partition 0 to which these both belong
- If this Index System had 2 partitions with 2 replicas each, the cells would be named:
- For partition 0: [I.0.0] and [I.1.0]
- For partition 1: [I.0.1] and [I.1.1]
- Each replica in a partition is simply numbered with a zero-based index (e.g. the first is I.0.0, the second replica is I.1.0, and so on…)
- All replicas in a given partition will have the same trailing number
In the next scenario, I started a large Full crawl and then started watching the output of this report. During a crawl:
- The CPCs submit content only to the Primary replica [cell] via the Index Router (a special thread which only runs on the Primary replica)
- The Primary replica also has the Journal Shipper thread running, whereas the other replicas in that partition instead have the Journal Receiver thread
- The Index Replicas [cells] all report their Journal/Index Generations to the ClusterManager thread running in the [Primary] Search Admin, which determines "in sync" status for the replica [cell] within the cluster
From there, each replica [cell] has an Index Plugin, which creates index parts, responds to queries, and merges those parts into a master index file. Because Index parts are created/merged independently by each replica [cell], "in sync" replicas [cells] within a partition [fragment] should have the same logical content across the replicas, but they may have different physical index parts on the file system until a master merge occurs.
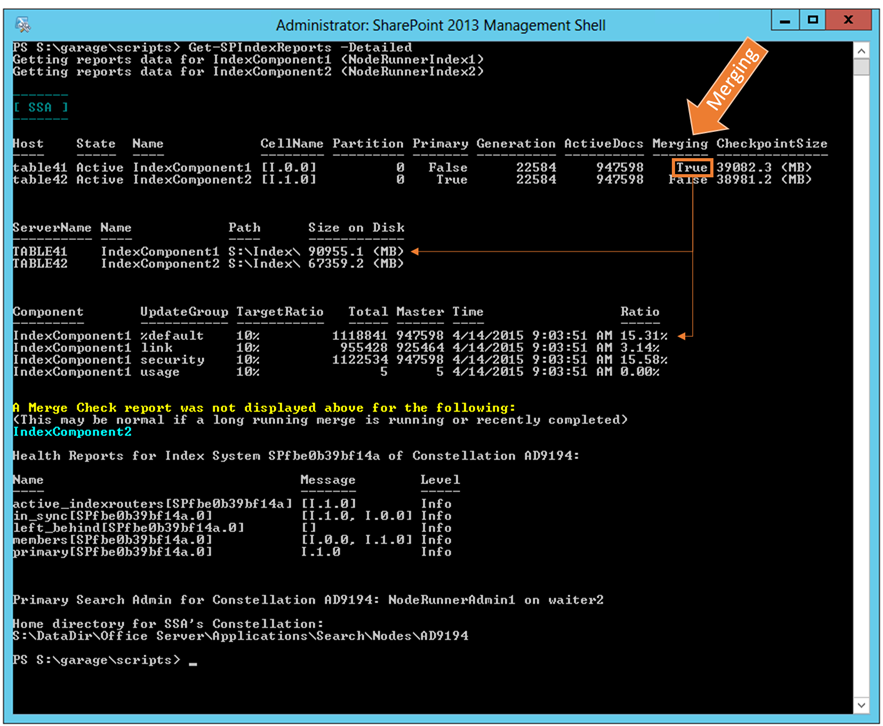
In other words, as more items get submitted to a given Index Component, the percentage of items existing in a shadow index part increases relative to the number of items existing in the "master" index part. When this ratio exceeds 10% (as defined by the "TargetRatio"), a Master Merge will get triggered for that given Update Group. Simplistically speaking, think of the master merge process as creating a new file that contains the original master part plus all of the new parts… anything overlapping is effectively replaced by the most recent sub-parts. Being said, this should explain why the physical file parts may grow up to three times as large as the "CheckpointSize" reported by the Search System.
From the image below, we can see where a Master Merge is running, which correlates with the ratio of the items in the %default Update Group for IndexComponent1 – at that time, a ratio of about 15%.
Note: I tend to focus only on the %default Update Group because it is typically the most substantial part of the index files and thus takes the disproportionate amount of time to merge than the other Update Groups. In other words, the other Update Groups are typically small/quick and thus irrelevant to most monitoring/troubleshooting.
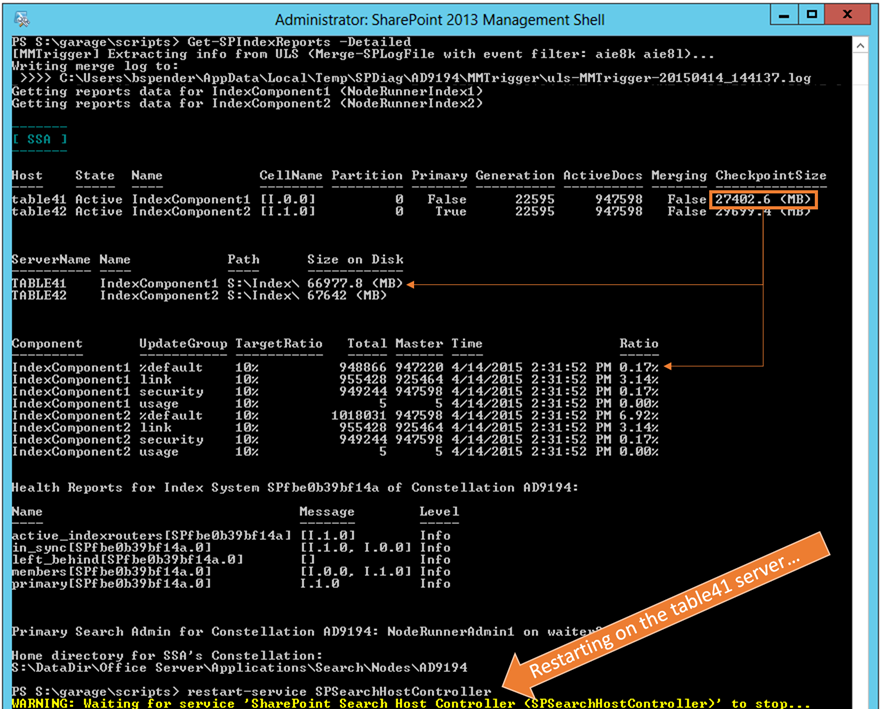
Upon completion of the Full crawl as well as a series of resulting Master Merges, the "CheckpointSize" and the "Ratio" are much smaller. However, in this case, the physical size of the index files remained high even after waiting several hours (and starting no other crawls).
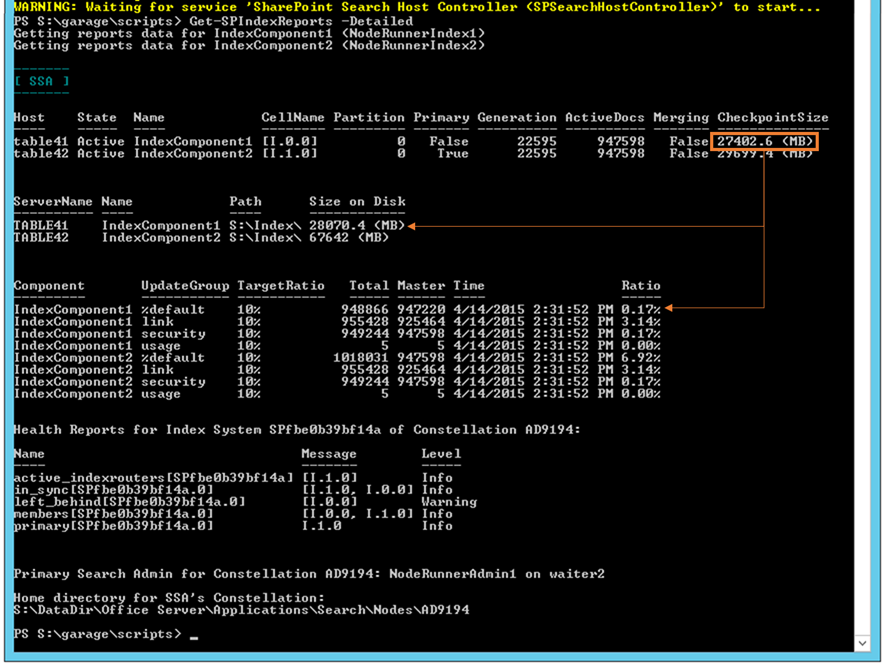
Eventually these will get removed (most likely in subsequent crawls), but they can be purged sooner by recycling the Host Controller service as demonstrated below:
Which – after a minute or so later – returned to an "Active" state and reported output such as below:
Bonus material:
After the Full crawl, I ran this cmdlet again with the "MMExit" flag:
Get-SPIndexReports -MMExit
This triggers another Merge-SPLogFile covering last 24 hours looking for event "acdru" as seen below. It's worth noting that this may be very heavy-handed with such a large duration to merge and should only be used conservatively (e.g. when troubleshooting something specific and avoid any sort of regularly scheduled run of this).
I have not yet converted this output into a friendly looking display, but the cmdlet does report the file location where the merge file gets written. In this case, I could see events such as the following:
04/14/2015 08:57:46.60 NodeRunnerIndex1 (TABLE41)
Search FsPlugin indexing tasks acdru Medium
%default MergeSet[IndexComponent1-f9ed646c-e520-4fc2-91fb-2ec963fae67a-SPfbe0b39bf14a.I.0.0](64988F22-50DD-45C5-A016-FA35702EF3A6) MergeId:0x0000003e.
Master merge exit after 3398875 ms (0:56:38.3398)
04/14/2015 09:12:57.66 NodeRunnerIndex2 (TABLE42)
Search FsPlugin indexing tasks acdru Medium
%default MergeSet[IndexComponent2-f9ed646c-e520-4fc2-91fb-2ec963fae67a-SPfbe0b39bf14a.I.1.0](35C70871-4EC7-46D0-818F-986D643A8A4E) MergeId:0x000000c7.
Master merge exit after 2448047 ms (0:40:48.2448)
-------------------------
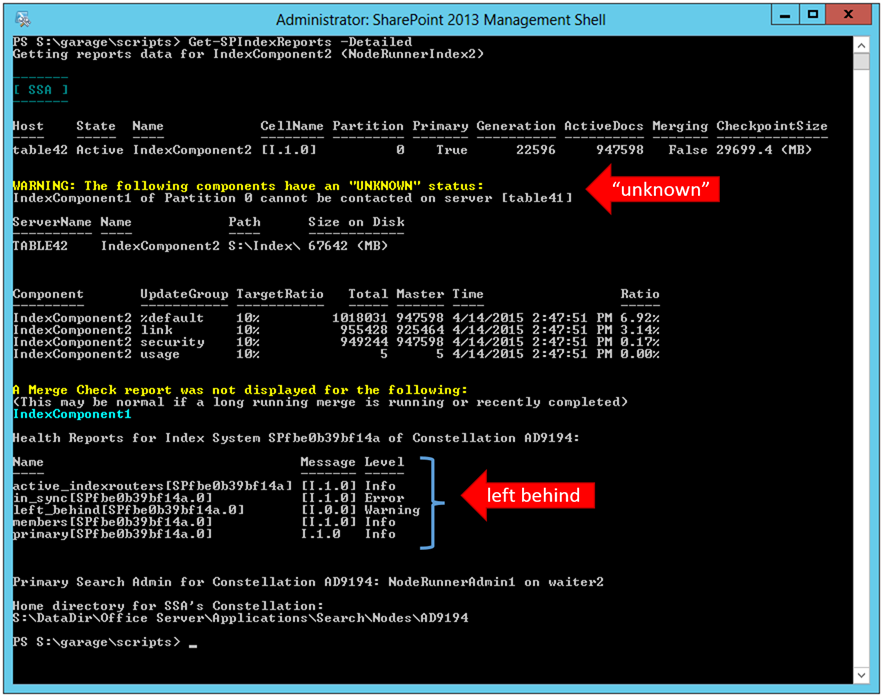
Example 2: A "Catastrophic" Failure
In another scenario, I demonstrated a catastrophic loss of my Index file path for IndexComponent1. With the component out of commission, the first run of the report illustrates the component as "Unknown" in a new a new table not displayed in the prior reports. It is also important to note that this cell I.0.0 (e.g. IndexComponent1) is now no longer "in sync" with the Primary replica and as a result, is considered "left behind".
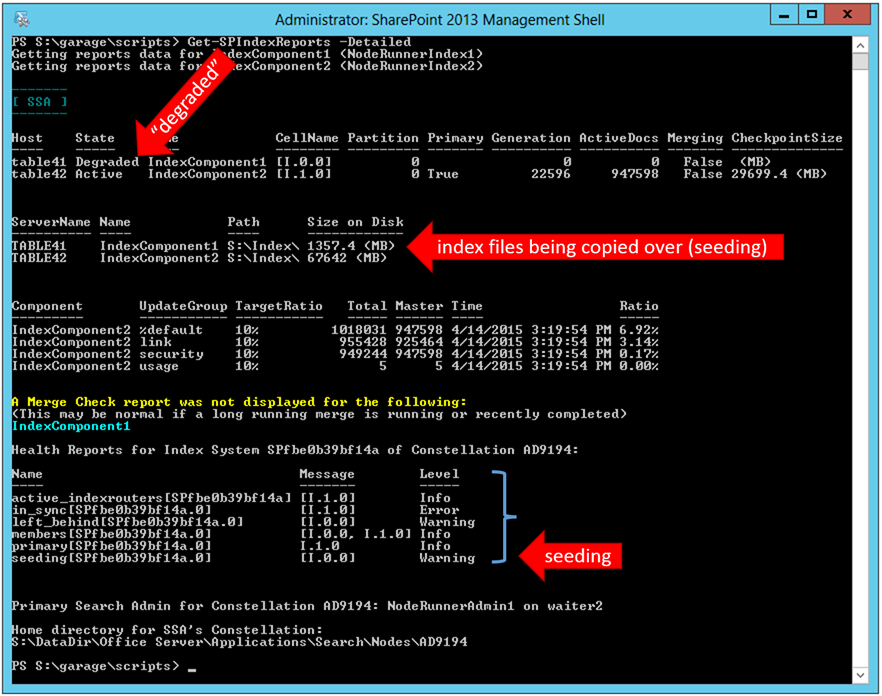
Once we restore the underlying problem with IndexComponent1, it once again begins to report status… initially as "Degraded". However, the Search System recognizes that this component [cell I.0.0] is out of sync with the primary, causing this to be moved into the "seeding" list. Seeding occurs by copying over all of the index files (including the "Journal" files, which act much like a database transaction log file) from the Primary replica to get back in sync.
I hope this helps explain more of what's occurring behind the scenes and make your life easier next time you see a "degraded" Index Component.