Build Canvas-based Heatmaps with Heatmap.js
I've always loved Crazyegg's heatmap functionality. It's a very cool method of seeing where users are clicking on your site and where the most activity is. I just stumbled upon Heatmap.js which lets you do that same thing. It uses the HTML5 Canvas element to dynamically generate the heatmaps based on your data.
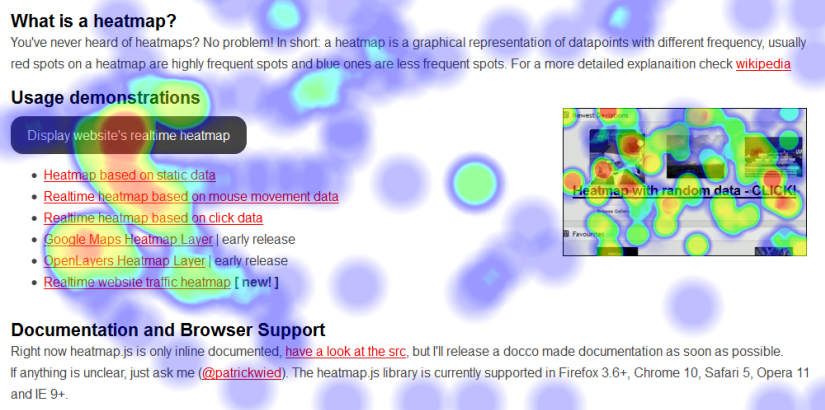
Heatmap instances contain a store in order to colorize the heatmap based on relative data, which means if you're adding only a single datapoint to the store it will be displayed as the hottest(red) spot, then adding another point with a higher count, it will dynamically recalculate.
If you check out the image below, you can see how hovering over the button accentuates the heatmap's colorization on that section:
The source is released under a very liberal MIT and Beerware license (yep, Beerware) and the author, Patrick Wied, is actively looking for contributions.