Live Debugging - Manage Code
Live Debugging - Manage Code
Introduction:
We will learn how to use windbg to perform Live debugging on manage code.
Requirement:
- Windbg (https://msdn.microsoft.com/en-us/windows/hardware/gg463009.aspx )
- SOS Extension (https://msdn.microsoft.com/en-us/library/bb190764.aspx )
- Symbol and source file for the executable.
Motive:
- Very useful to troubleshoot the error which can be easily re-created in testing environment.
- Give us full access to any method inside any loaded module to see the under the hood stuff.
Process:
- Run the executable.
- Attach windbg to the process.
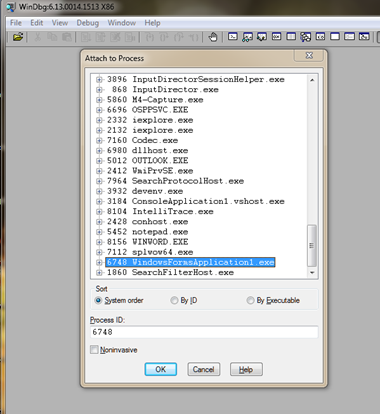
3. As soon as we attach the debugger, it will break into the process.
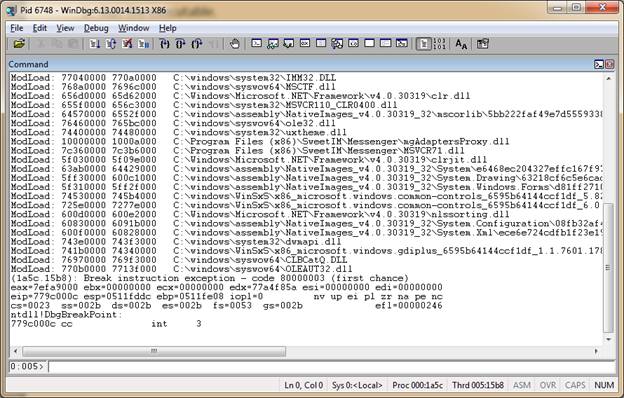
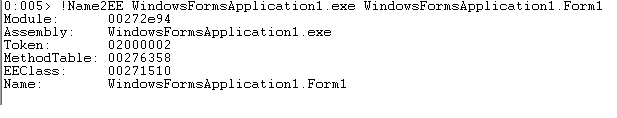
4. Next step will be finding the module which we want to troubleshoot.
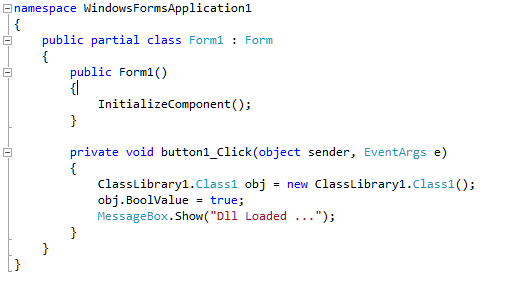
5. In the above example I have created a Win Form app, and I want to see what exactly goes on inside the Button Click event.
6. So I need to find the module where Button Click code is written.
7. Actual code structure:
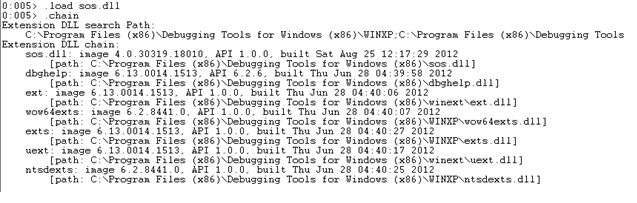
8. To search a specific module, we need to load the SOS.DLL
9. We can check the DLL status by using .Chain command.
10. Next step is to set search the module.
11. Once we get the Module, we need to set the break point on the selected method.
12. To get list of methods inside the module, we need to dump the method table.
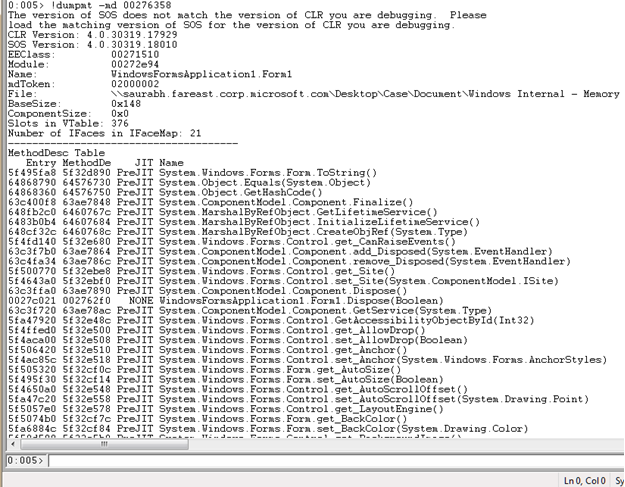
13. We got our Button click event.
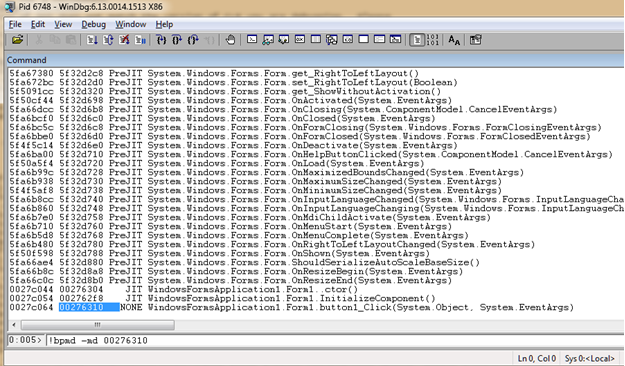
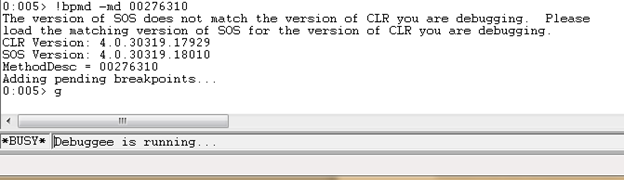
14. Once we run the above command the debugger will add a break point on this method and as soon as the event occurs, we will see the debugger breaking inside the code…
Press “g” to start the windbg with a break point in position….
15. Next step is to perform the button click.
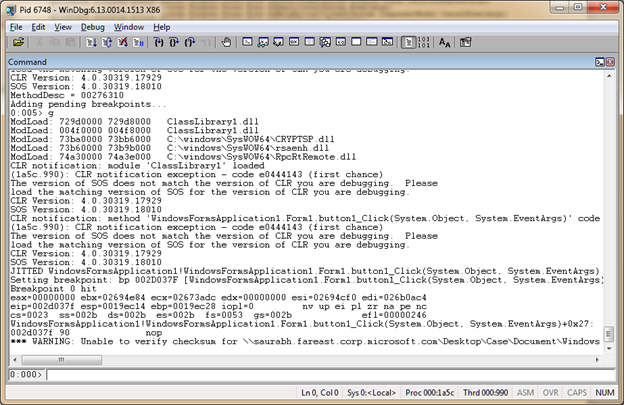
16. Once we see the debugger in break state, we can review the variables and parameters via Dis-assemble window inside the Windbg.
I hope that helps to explore more from windbg live debugging.